Hello, In this post I will explain how to set up Cassandra monitoring with influxDB and Grafana. This can also be used to connect to other monitoring systems (Graphite, Collectd, etc...) but since both influxDB and Grafana are hot topics at the moment I decided to follow the trend! I was asked why I was doing this when a tool like OpsCenter is available, but sometimes you want to have all your systems reporting to a single dashboard. And if your dashboard is Grafana and your Backend is influxDB then you will learn how to connect Cassandra to it! Assumptions: - You are running a Linux system (This post is based on CentOS 7) - You are using Cassandra 1.2+ (I'm using 2.1.3 in this case)
 Want to Learn more about
Pythian's Cassandra Services?
Want to Learn more about
Pythian's Cassandra Services?
Prerequisites
- Cassandra Installation
- Graphite Metrics Jar
- influxDB - https://influxdb.com/
- Grafana - https://grafana.org/
- Apache (Any webserver would do)
Installing and configure influxDB
This one is dead easy, once you have the package install it (rpm -i, dpkg -i). Start the service: [code]service influxdb start[/code] Once the service is running, go to the configuration ( /opt/influxdb/shared/config.toml) and edit the file so that under [input_plugins] it looks like this: [code] # Configure the graphite api [input_plugins.graphite] enabled = true # address = "0.0.0.0" # If not set, is actually set to bind-address. port = 2003 database = "cassandra-metrics" # store graphite data in this database udp_enabled = true [/code] Save the file, reload the service: [code]service influxdb reload[/code] Now go to your browser localhost:8083, click connect (no credentials should be needed), and after you logged in, enter in a database name (use cassandra-metrics) and click Create (This should be your only option). Now you can click the database, and add an user to it (and make it admin). Now create another database, with name "grafana", create an admin for that database also. Now you are done with influxDB.Installing Grafana
Grafana is a bit more tricky, since it is needed to configure a webserver also. Let's assume apache is installed, and the home directory for www is /var/www/html. So get the grafana package and extract it to /var/www/html. So the end result should be something like /var/www/html/grafana. Now do the following: [code] cd /var/www/html/grafana cp config.sample.js config.js [/code] Now let's configure the connection between influXDB and Grafana. Open for edit the new copied file config.js and edit it so it looks like this: [code] datasources: { influxdb: { type: 'influxdb', url: "https://localhost:8086/db/cassandra-metrics", username: 'admin', password: 'admin', }, grafana: { type: 'influxdb', url: "https://localhost:8086/db/grafana", username: 'admin', password: 'admin', grafanaDB: true }, }, [/code] Now redirect your browser to localhost/grafana and you will have the Grafana default dashboard.Preparing Cassandra
Now the final piece of the puzzle. Now we follow more or less the Cassandra guide that exists here, but we need to make some changes to make it more valuable (and allow multiple nodes to provide metrics). So, first of all, put the metrics-graphite-2.2.0.jar in all the Cassandra nodes /lib directory. Now create a yaml file with similar to the Datastax example, lets call it influx-reporting.yaml and store it on /conf directory. Now edit the file again so it looks like this: [code] graphite: - period: 60 timeunit: 'SECONDS' prefix: 'Node1' hosts: - host: 'localhost' port: 2003 predicate: color: "white" useQualifiedName: true patterns: - ".*" [/code] What did we change here, first we added a prefix field, this will allow us to identify the node that is providing the metrics. It must be different for every node, otherwise the metrics will overwrite/mix with each other. Then we decided to allow all patterns (".*"), this means that Cassandra will push out all the metrics into influxDB. You can decide whether or not this is too much and just enable the metrics you want (find out more about it here). Now edit the cassandra-env.sh so that it will read the yaml file to provide the metrics. Add the following line to the end of the file: [code] JVM_OPTS="$JVM_OPTS -Dcassandra.metricsReporterConfigFile=influx-reporting.yaml" [/code] If all is done correctly, you can restart the Cassandra node (or nodes, but don't do it all at the same time, 2min between each is recommended) and if the log file has the following message: [code] INFO [main] YYYY-MM-DD HH:MM:SS,SSS CassandraDaemon.java:353 - Trying to load metrics-reporter-config from file: inf lux-reporting.yaml INFO [main] YYYY-MM-DD HH:MM:SS,SSS GraphiteReporterConfig.java:68 - Enabling GraphiteReporter to localhost:2003 [/code] All is good!Graphing!
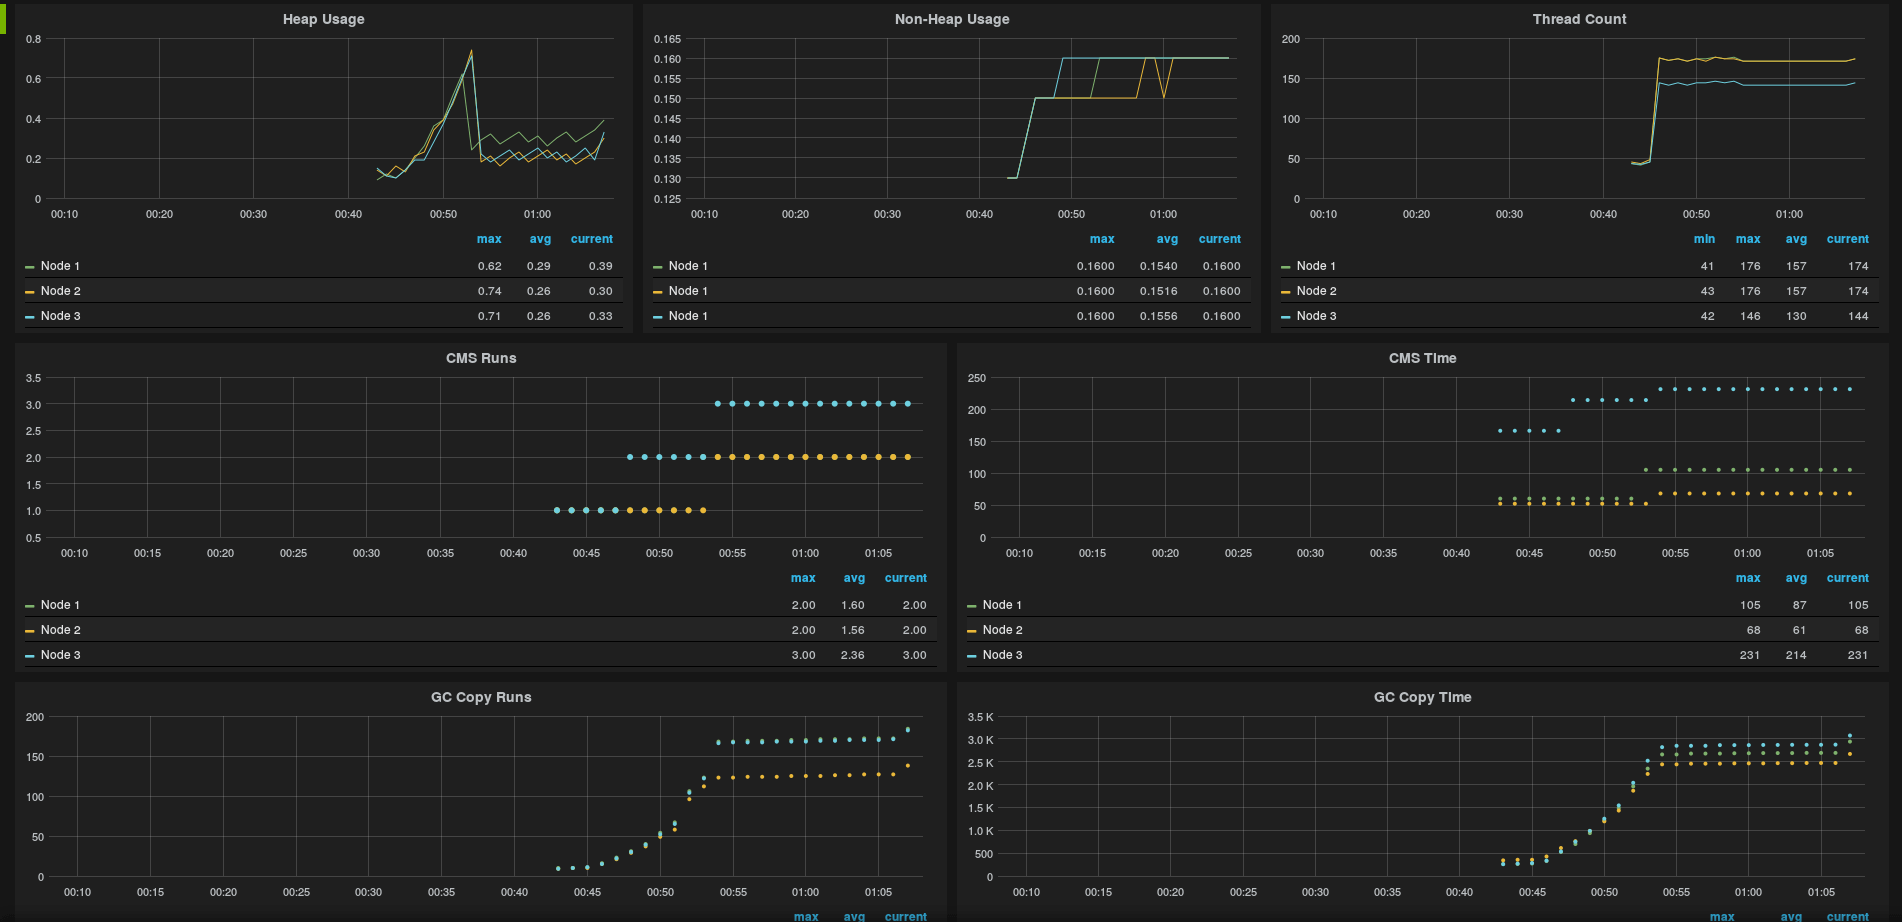
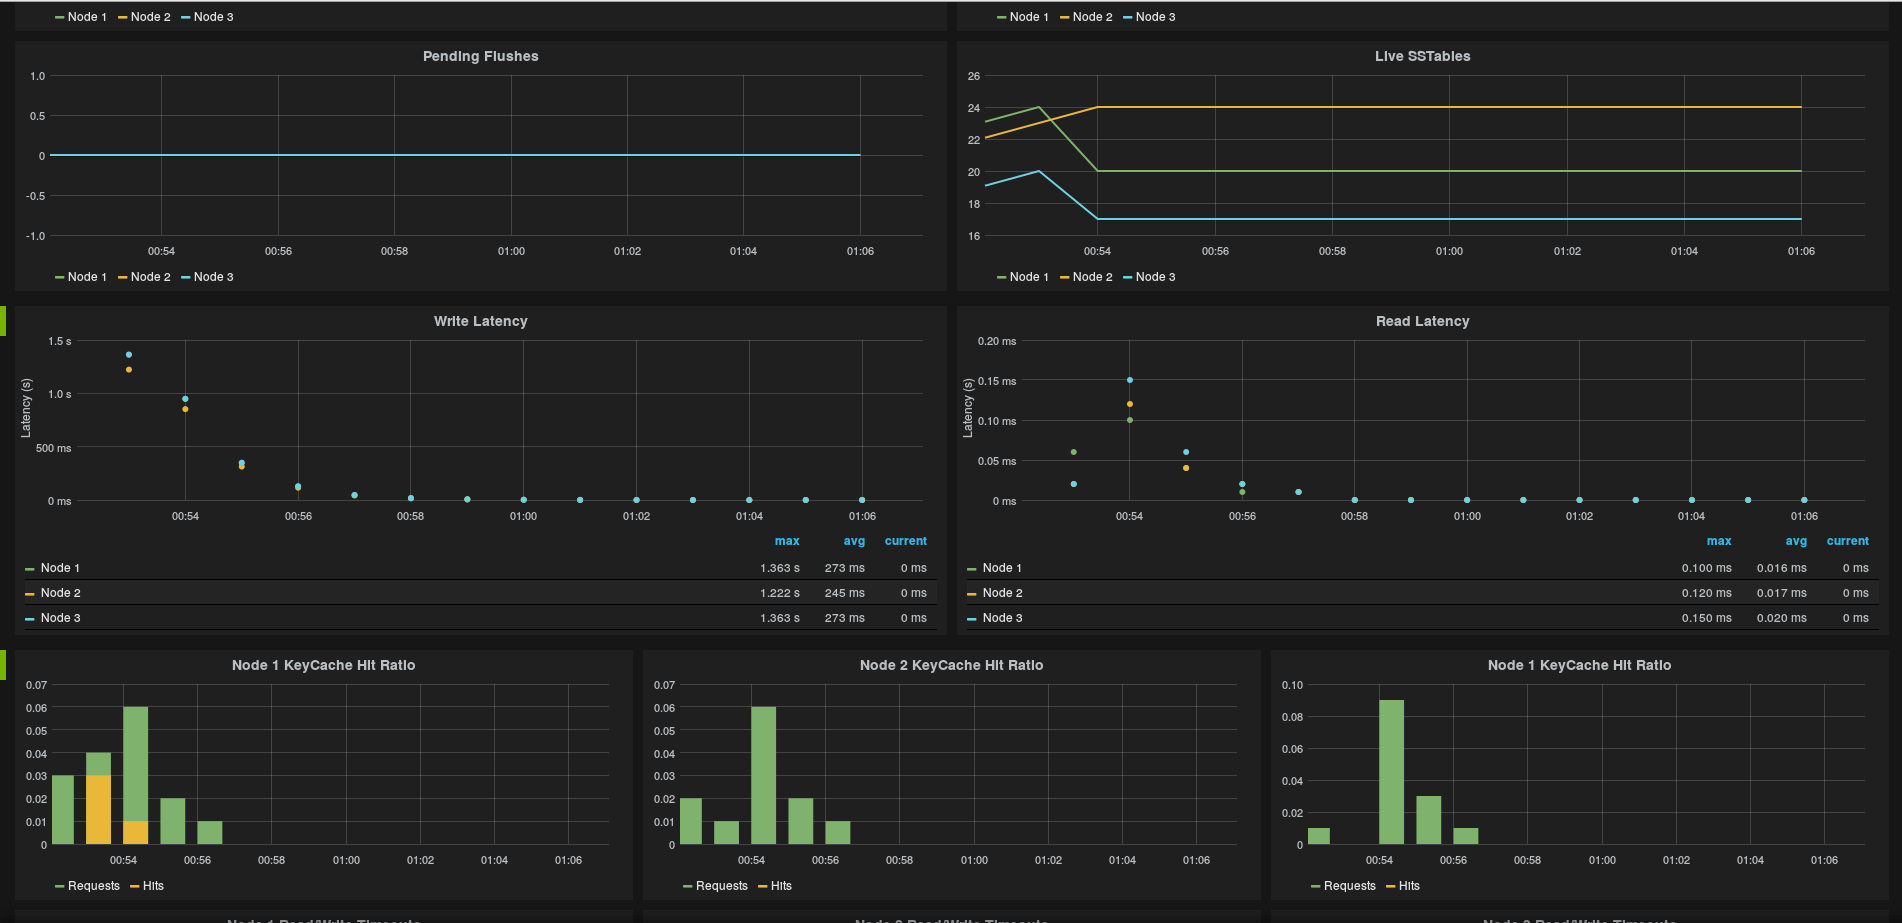
Grafana is not that difficult to use, so once you start exploring a bit (And reading the documentation) you will find out doing nice graphs. This could be a long post only about graphing out, so I'm just go and post some images of the graphs I'm getting out of Grafana so that you can see how it can be powerful and help you on keeping your Cassandra Healthy.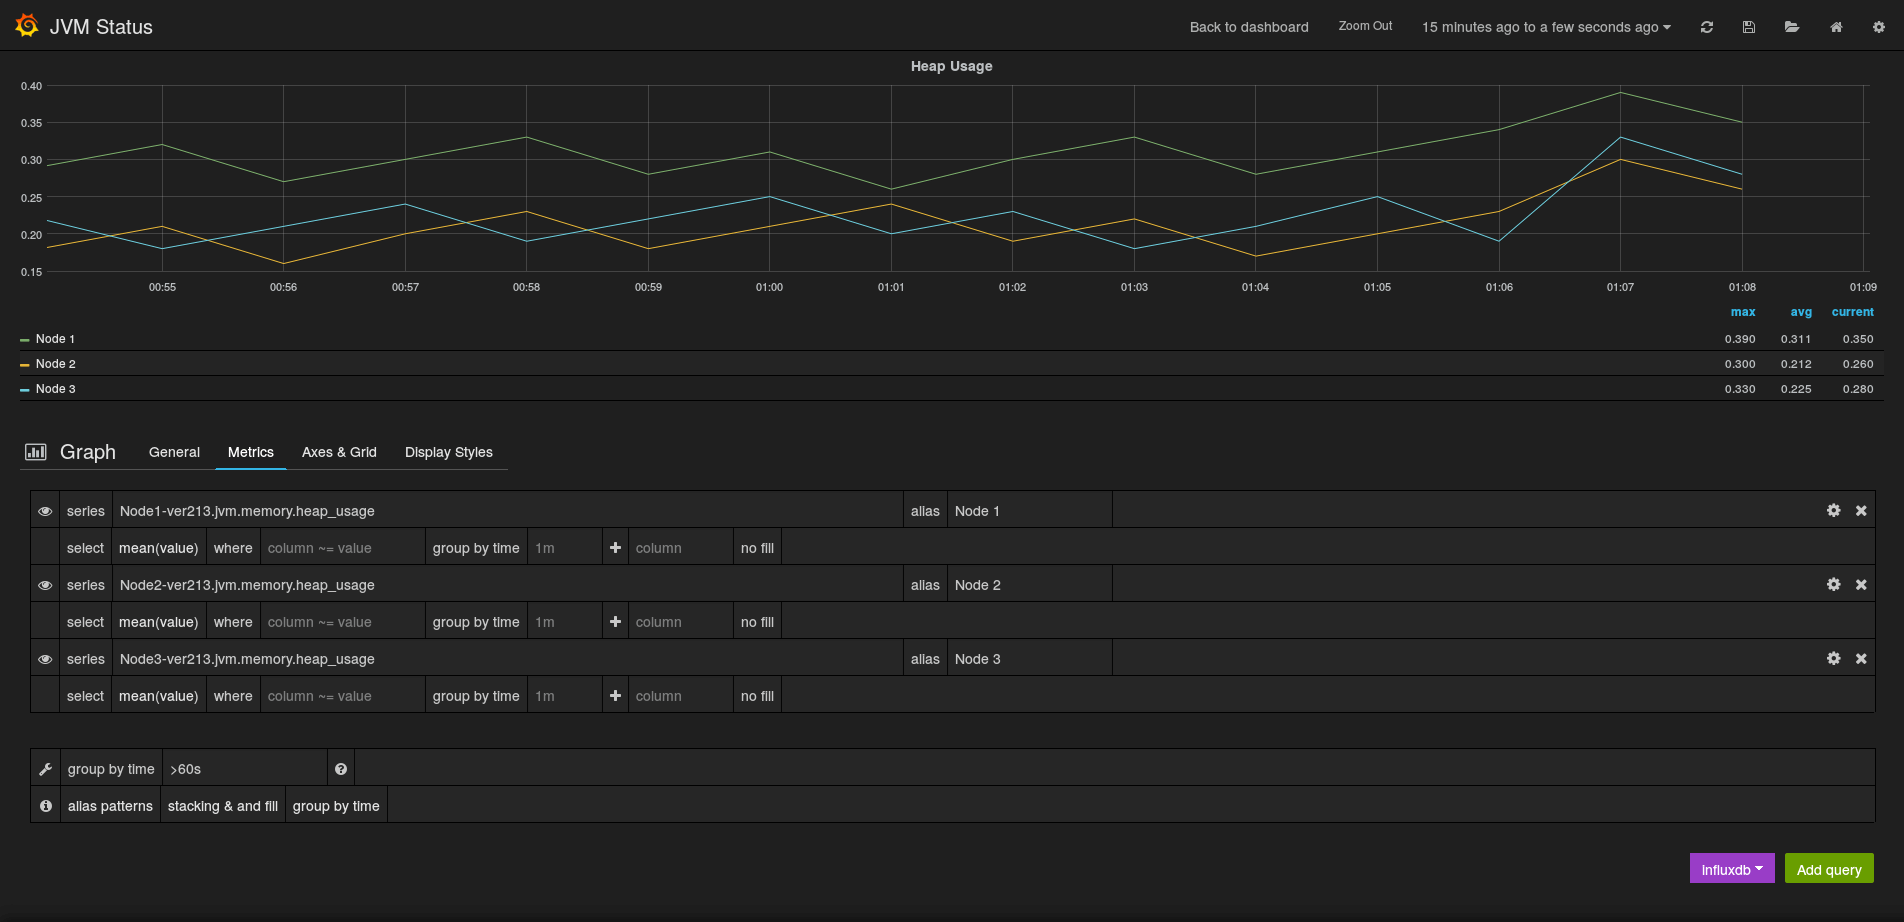
 Want to Learn more about
Pythian's Cassandra Services?
Want to Learn more about
Pythian's Cassandra Services?

