I was recently asked to set up a solution for Cassandra open-source log analysis to include in an existing Elasticsearch-Logstash-Kibana (ELK) stack. After some research on more of the newer capabilities of the technologies, I realized I could use "beats" in place of the heavier logstash processes for basic monitoring. This basic monitoring would not involve extensive log transformation.
The code to run this demo is available to clone or fork at
https://github.com/pythian/cassandra-elk
. The only other requirement is Docker (I am using Docker version 18.05.0-ce-rc1) -- using Docker for Mac or Docker for Windows will be most convenient.
In a typical production system, you would already have Cassandra running, but all the pieces are included in the Docker stack here so you can start from zero. The model here assumes ELK and a Cassandra cluster are running in your environment, and you need to stream the Cassandra logs into your monitoring system.
In this setup, the Cassandra logs are being ingested into Elasticsearch and visualized via Kibana. I have included some ways to see data at each step of the workflow in the final section below.
Start the containers:
 Set up the filebeat software
Do the following on each Cassandra node.
1. Download the software
You would likely not need to install curl in your environment, but the Docker images used here are bare-bones by design. The
apt update
statement is also necessary since typically repos are cleared of files after the requested packages are installed via the Dockerfile.
Set up the filebeat software
Do the following on each Cassandra node.
1. Download the software
You would likely not need to install curl in your environment, but the Docker images used here are bare-bones by design. The
apt update
statement is also necessary since typically repos are cleared of files after the requested packages are installed via the Dockerfile.
 Here are some sample queries to run in Kibana:
 If you would like to see what the logs look at each step of the workflow, view logs within the Cassandra container in /var/log/cassandra like this:
docker-compose up -d
(Note: The cassandra-env.sh included with this test environment limits the memory used by the setup via MAX_HEAP_SIZE and HEAP_NEWSIZE, allowing it to be run on a laptop with small memory. This would not be the case in production.)
Set up the test Cassandra cluster:
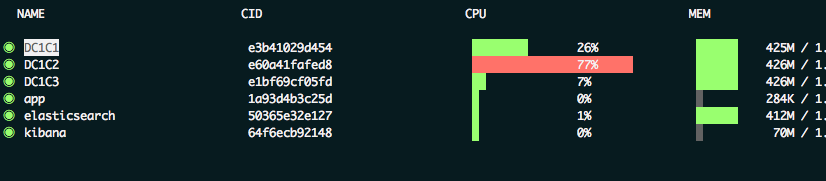
As the Docker containers are starting up, it can be convenient to see resource utilization via ctop:
Set up the filebeat software
Do the following on each Cassandra node.
1. Download the software
You would likely not need to install curl in your environment, but the Docker images used here are bare-bones by design. The
apt update
statement is also necessary since typically repos are cleared of files after the requested packages are installed via the Dockerfile.
apt update

 apt install curl -y

 curl -L -O https://artifacts.elastic.co/downloads/beats/filebeat/filebeat-6.2.3-amd64.deb

 dpkg -i filebeat-6.2.3-amd64.deb
For other operating systems, see: https://www.elastic.co/guide/en/beats/filebeat/current/filebeat-installation.html . 2. Configure filebeat The beats software allows for basic filtering and transformation via this configuration file. Put the below in /etc/filebeat/filebeat.yml. (This is edited from an example at: https://github.com/thelastpickle/docker-cassandra-bootstrap/blob/master/cassandra/config/filebeat.yml .) The values in the output.elasticsearch and setup.kibana are their respective IP addresses and port numbers. For filebeat.prospectors -- a prospector manages all the log inputs -- two types of logs are used here, the system log and the garbage collection log. For each, we will exclude any compressed (.zip) files. The multiline* settings define how multiple lines in the log files are handled. Here, the log manager will find files that start with any of the patterns shown and append the following lines not matching the pattern until it reaches a new match. More options available at: https://www.elastic.co/guide/en/beats/filebeat/current/multiline-examples.html.
output.elasticsearch:

  enabled: true

  hosts: ["172.16.238.31:9200"]

 setup.kibana:

  host: "172.16.238.33:5601"

 filebeat.prospectors:

  - input_type: log

  paths:

  - "/var/log/cassandra/system.log*"

  document_type: cassandra_system_logs

  exclude_files: ['\.zip$']

  multiline.pattern: '^TRACE|DEBUG|WARN|INFO|ERROR'

  multiline.negate: true

  multiline.match: after

  - input_type: log

  paths:

  - "/var/log/cassandra/debug.log*"

  document_type: cassandra_debug_logs

  exclude_files: ['\.zip$']

  multiline.pattern: '^TRACE|DEBUG|WARN|INFO|ERROR'

  multiline.negate: true

  multiline.match: after
3. Set up Kibana dashboards
filebeat setup --dashboards
Example output:
Loaded dashboards
4. Start the beat
service filebeat start
Example output:
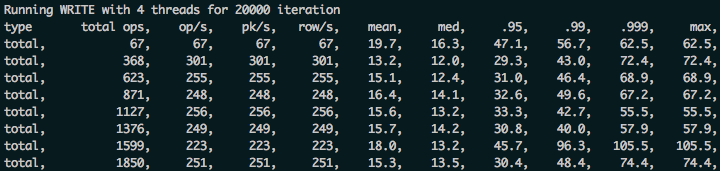
2018-04-12T20:43:03.798Z INFO instance/beat.go:468 Home path: [/usr/share/filebeat] Config path: [/etc/filebeat] Data path: [/var/lib/filebeat] Logs path: [/var/log/filebeat]

 2018-04-12T20:43:03.799Z INFO instance/beat.go:475 Beat UUID: 2f43562f-985b-49fc-b229-83535149c52b

 2018-04-12T20:43:03.800Z INFO instance/beat.go:213 Setup Beat: filebeat; Version: 6.2.3

 2018-04-12T20:43:03.801Z INFO elasticsearch/client.go:145 Elasticsearch url: https://172.16.238.31:9200

 2018-04-12T20:43:03.802Z INFO pipeline/module.go:76 Beat name: C1

 Config OK
View the graphs: Then view the Kibana graphs in a local browser at: https://localhost:5601 . Run some sample load against one of the nodes to get more logs to experiment with:
cassandra-stress write n=20000 -pop seq=1..20000 -rate threads=4
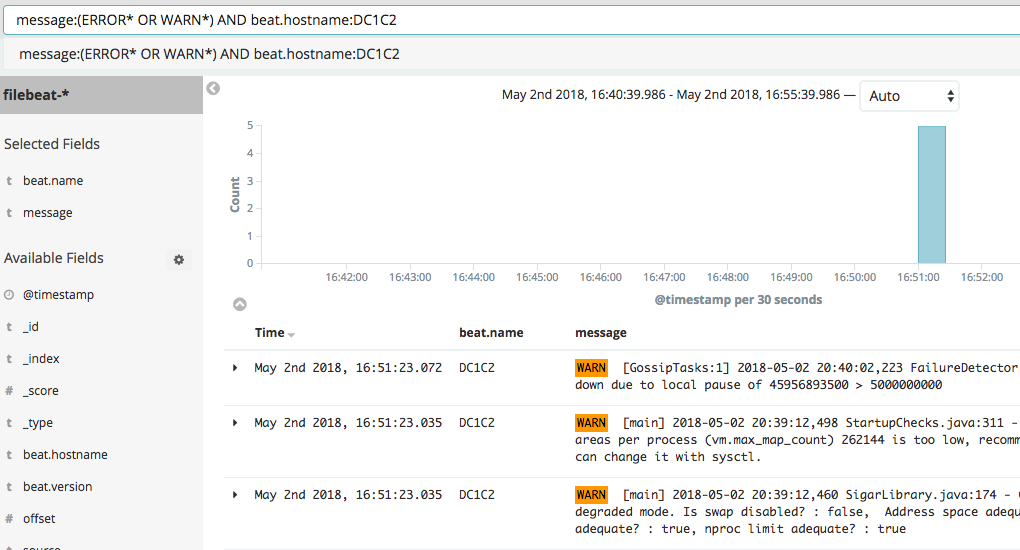
Here are some sample queries to run in Kibana:
- message:WARN*
- message:(ERROR* OR WARN*)
- message:(ERROR* OR WARN*) AND beat.hostname:DC1C2
If you would like to see what the logs look at each step of the workflow, view logs within the Cassandra container in /var/log/cassandra like this:
tail /var/log/cassandra/debug.log
Example output:
WARN [PERIODIC-COMMIT-LOG-SYNCER] 2018-05-07 14:01:09,216 NoSpamLogger.java:94 - Out of 0 commit log syncs over the past 0.00s with average duration of Infinityms, 1 have exceeded the configured commit interval by an average of 80.52ms
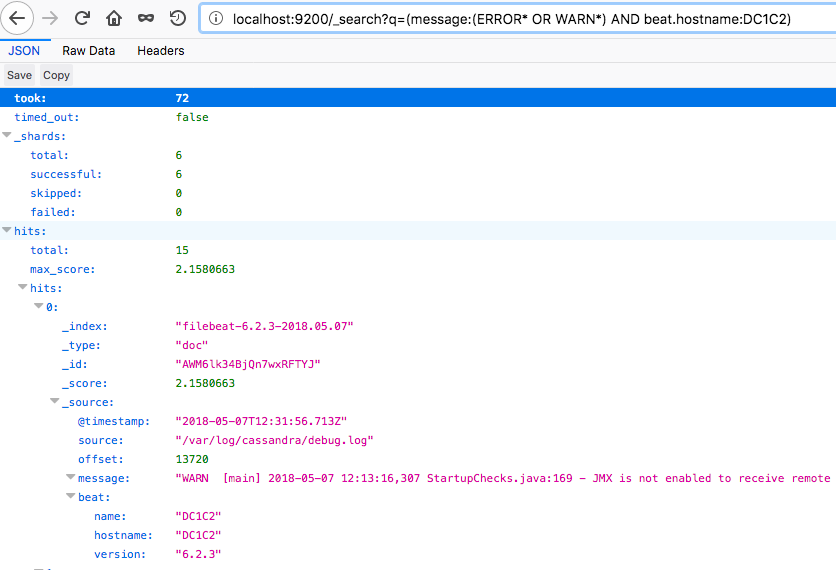
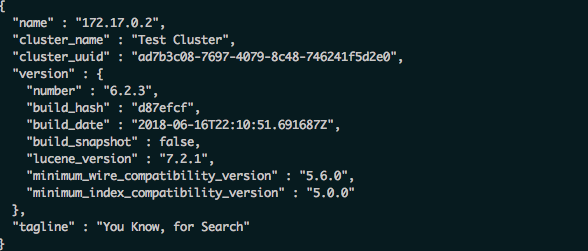
View this data stored in Elasticsearch (in JSON format) in a browser like this:
https://localhost:9200/_search?q=(message:(ERROR*%20OR%20WARN*)%20AND%20beat.hostname:DC1C2)
Example output:
On this page
Share this
Share this
How to Secure Your Elastic Stack (Plus Kibana, Logstash and Beats)
![]()
How to Secure Your Elastic Stack (Plus Kibana, Logstash and Beats)
Jan 15, 2021 12:00:00 AM
8
min read
How to migrate data from Cassandra to Elassandra in Docker containers
How to migrate data from Cassandra to Elassandra in Docker containers
Jul 3, 2018 12:00:00 AM
3
min read
How to Deploy Spark in DataStax Cassandra 5.1

How to Deploy Spark in DataStax Cassandra 5.1
Jan 31, 2022 12:00:00 AM
4
min read