Exadata Smart Scan: A Quick Overview
Introduction
I decided to write about Exadata Smart Scan feature for this blog post. Why Smart Scan? Well, because it is awesome and I don’t know any other relational database system that has this feature.

So what is Smart Scan and why it is awesome?
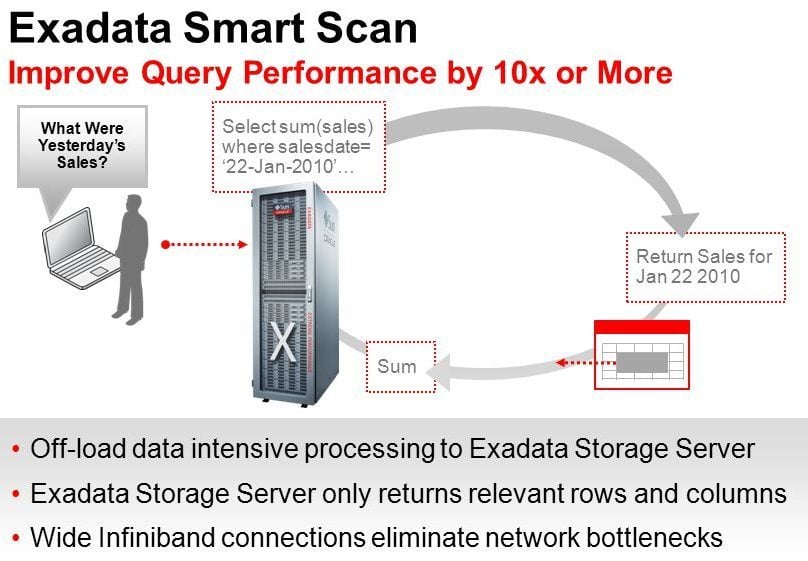
Simply put, Smart Scan is the capability of an Oracle Database to offload SQL processing to the Exadata Storage Servers. It is awesome because the database itself has less data to process once the storage servers process a large amount of data and return just a small portion to the database itself. Smart Scan works better with Data Warehouse/DSS databases than with OLTP databases. I’m not saying that an OLTP database cannot take advantage of Smart Scan. The thing is that OLTP database is normally defined by a database that gets single-row queries and Smart Scan works better with many, many rows. We all know that most database workloads are mixed, so we have both DW/DSS and OLTP queries. For the Smart Scan to work, the SQL you run must have these requirements:
- The segment you are querying must be stored in an Exadata Database Machine where the disk group with the cell.smart_scan_capable attribute is set to true.
- A Full Table Scan or an Index Fast Full Scan operation must occur.
- The segment must be big enough to fire a direct path read operation.
SQL> select segment_name, segment_type, bytes/1024/1024 mb from user_segments where segment_name='SALES'

 SEGMENT_NAME SEGMENT_TYPE MB
 -------------------- ------------------ ----------
 SALES TABLE 1984

 SQL> select count(*) from sales

  COUNT(*)
 ----------
  20000000

 Elapsed: 00:00:03.97
To control the cell offloading capability, we have the cell_offload_processing parameter which defaults to true, meaning we can use Smart Scan by default if we are running our database in an Exadata:
SQL> show parameter cell_offload_processing

 NAME TYPE VALUE
 ------------------------------------ ----------- ------------------------
 cell_offload_processing boolean TRUE
I am changing that parameter to false with a hint for the execution:
SQL> select /*+ OPT_PARAM('cell_offload_processing' 'false') */ max(ORDER_DATE) from SALES;

 MAX(ORDER
 ---------
 28-SEP-19

 Elapsed: 00:00:16.52
We can see above that the execution time was 16.52 seconds without the Smart Scan. We can see below when I query the statistics for the session that the Smart Scan capability was not used. We see 1901MB of physical reads and 1901MB were returned by the interconnect from the cell (storage servers) to the database servers:
SQL> select s.name, m.value/1024/1024 mb from v$mystat m, v$sysstat s where m.statistic#=s.statistic# and (s.name like '%physical IO%' or s.name like '%optimized%' or s.name like 'physical%total bytes');

 NAME MB
 ---------------------------------------------------------------- ----------
 physical read requests optimized 7.6294E-06
 physical read total bytes optimized .921875
 physical read total bytes 1901.14063
 physical write requests optimized 0
 physical write total bytes optimized 0
 physical write total bytes 0
 cell physical IO interconnect bytes 1901.14063
 cell physical IO bytes saved during optimized file creation 0
 cell physical IO bytes saved during optimized RMAN file restore 0
 cell physical IO bytes eligible for predicate offload 0
 cell physical IO bytes saved by storage index 0
 cell physical IO bytes sent directly to DB node to balance CPU 0
 cell physical IO interconnect bytes returned by smart scan 0
 cell simulated physical IO bytes eligible for predicate offload 0
 cell simulated physical IO bytes returned by predicate offload 0

 15 rows selected.

 Elapsed: 00:00:00.01
Now I’m disconnecting and reconnecting to reset the session statistics and I’m running the query without any hint so my execution will get the default value of true for the cell_offload_processing parameter:
SQL> select max(ORDER_DATE) from SALES;

 MAX(ORDER
 ---------
 28-SEP-19

 Elapsed: 00:00:04.36
We can see the time dropped by four times. That is because the Smart Scan feature was used. We can confirm that by querying the session statistics again:
SQL> select s.name, m.value/1024/1024 mb from v$mystat m, v$sysstat s where m.statistic#=s.statistic# and (s.name like '%physical IO%' or s.name like '%optimized%' or s.name like 'physical%total bytes');

 NAME MB
 ---------------------------------------------------------------- ----------
 physical read requests optimized 0
 physical read total bytes optimized 0
 physical read total bytes 1901.14063
 physical write requests optimized 0
 physical write total bytes optimized 0
 physical write total bytes 0
 cell physical IO interconnect bytes 275.122597
 cell physical IO bytes saved during optimized file creation 0
 cell physical IO bytes saved during optimized RMAN file restore 0
 cell physical IO bytes eligible for predicate offload 1901.14063
 cell physical IO bytes saved by storage index 0
 cell physical IO bytes sent directly to DB node to balance CPU 0
 cell physical IO interconnect bytes returned by smart scan 275.122597
 cell simulated physical IO bytes eligible for predicate offload 0
 cell simulated physical IO bytes returned by predicate offload 0

 15 rows selected.

 Elapsed: 00:00:00.00
We see now that the total number of physical reads is the same, but the bytes returned by the interconnect is only 275MB which is also the same amount returned by Smart Scan. That is why the query ran faster; the storage servers processed the data and returned only what matters to my query. The Smart Scan feature gets the advantage of the Column Projection and Predicate Filtering operations meaning that only the data from the rows and the columns that we are actually querying are returned to the database. I mentioned that a Direct Path Read operation must occur for the database to be able to use the Smart Scan feature. Let’s see an example when I disable the Direct Path Read by changing the hidden parameter _serial_direct_read to never:
SQL> alter session set "_serial_direct_read" = never;

 Session altered.

 Elapsed: 00:00:00.00
 SQL> select max(ORDER_DATE) from SALES;

 MAX(ORDER
 ---------
 28-SEP-19

 Elapsed: 00:00:25.52
We can see that not only does it take more time than the first execution, but all the data that was supposed to go directly to the session PGA went to the Buffer Cache:
SQL> select s.name, m.value/1024/1024 mb from v$mystat m, v$sysstat s where m.statistic#=s.statistic# and (s.name like '%physical IO%' or s.name like '%optimized%' or s.name like 'physical%total bytes');

 NAME MB
 ---------------------------------------------------------------- ----------
 physical read requests optimized .000020027
 physical read total bytes optimized .9609375
 physical read total bytes 1901.23438
 physical write requests optimized 0
 physical write total bytes optimized 0
 physical write total bytes 0
 cell physical IO interconnect bytes 1901.23438
 cell physical IO bytes saved during optimized file creation 0
 cell physical IO bytes saved during optimized RMAN file restore 0
 cell physical IO bytes eligible for predicate offload 0
 cell physical IO bytes saved by storage index 0
 cell physical IO bytes sent directly to DB node to balance CPU 0
 cell physical IO interconnect bytes returned by smart scan 0
 cell simulated physical IO bytes eligible for predicate offload 0
 cell simulated physical IO bytes returned by predicate offload 0

 15 rows selected.

 Elapsed: 00:00:00.00
Nice, isn’t it? I hope you enjoy Smart Scan as much as I do!
Oracle Database Consulting Services
Ready to optimize your Oracle Database for the future?
Share this
Share this
More resources
Learn more about Pythian by reading the following blogs and articles.
Exadata smart scans and the flash cache
Exadata's Best Kept Secret: Storage Indexes

How to Resize Exadata Grid Disks Without an Outage
Ready to unlock value from your data?
With Pythian, you can accomplish your data transformation goals and more.
