Forum questions can sometimes cause distractions for me because they pique my interest at times, especially when I see someone say "Extended Event (XE) session is not showing the expensive query". Extended Events are just...  The particular forum question that caught my attention span today was on DBA StackExchange (DBA.SE) site: Expensive Query not showing in extended events trace. In this question the individual was troubleshooting the infamous "FETCH_API_CURSORxxxxxxx" queries. The were slowly degrading the performance of their server. In the question, they do not give the exact definition of their XE session, at least at the time of this writing. I would make the assumption they are just trying to capture it using actions like rpc_complete, as you do in a Profiler Trace. The most common blog post you will find referenced for "hunting" the query down is Joseph Sack's blog post on SQL Skills site: Hunting down the origins of FETCH API_CURSOR and sp_cursorfetch. Which the article references he was dealing with SQL Server 2008 R2, which while it had XE available was not that powerful at the time. You will also find an article from Pinal Dave on the same topic: SQL SERVER – What is the query used in sp_cursorfetch and FETCH API_CURSOR?. In both cases, the authors note the use of Profiler to capture the workload. Pinal even mentions having to capture the whole workload on the server. Which for the most part you can try to narrow down/filter the trace for Profiler or XE to say the login, Application Name or host name. Overall though a Profile trace is going to have to generally capture a lot of traffic. The saving grace here is that XE sessions can be used to only capture the specific events you want, and there just happens to be events for capturing API cursors: cursor_open and cursor_close. The cursor_open event includes an action to show you the T-SQL text being executed, along with other various bits of information. The remainder of this post I'm going to show you how I setup a test to compare what Profiler and XE would capture.
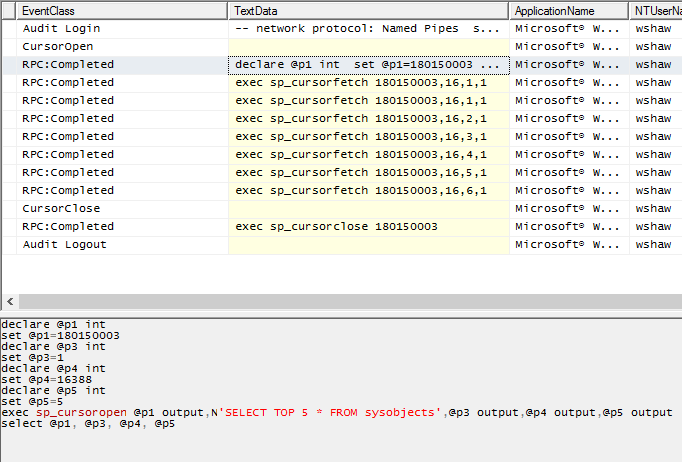 Pretty standard to what most folks are used to seeing, the only way to see the query is that first rpc_completed event. As you can also see the cursor event classes show nothing in the text_data value.
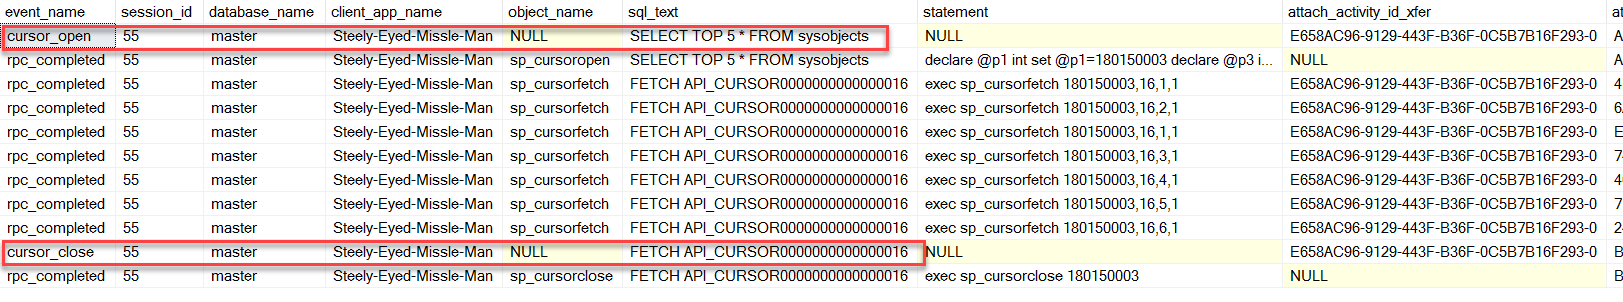
You can see the "attach_activity_id_xfer" column shows the same value, so this is all activity from one session. The first two rows of the table I can see were fired in sequence going by the "attach_activity_id" value.
 Enjoy and happy troubleshooting. The content of this post can also be found here.
The particular forum question that caught my attention span today was on DBA StackExchange (DBA.SE) site: Expensive Query not showing in extended events trace. In this question the individual was troubleshooting the infamous "FETCH_API_CURSORxxxxxxx" queries. The were slowly degrading the performance of their server. In the question, they do not give the exact definition of their XE session, at least at the time of this writing. I would make the assumption they are just trying to capture it using actions like rpc_complete, as you do in a Profiler Trace. The most common blog post you will find referenced for "hunting" the query down is Joseph Sack's blog post on SQL Skills site: Hunting down the origins of FETCH API_CURSOR and sp_cursorfetch. Which the article references he was dealing with SQL Server 2008 R2, which while it had XE available was not that powerful at the time. You will also find an article from Pinal Dave on the same topic: SQL SERVER – What is the query used in sp_cursorfetch and FETCH API_CURSOR?. In both cases, the authors note the use of Profiler to capture the workload. Pinal even mentions having to capture the whole workload on the server. Which for the most part you can try to narrow down/filter the trace for Profiler or XE to say the login, Application Name or host name. Overall though a Profile trace is going to have to generally capture a lot of traffic. The saving grace here is that XE sessions can be used to only capture the specific events you want, and there just happens to be events for capturing API cursors: cursor_open and cursor_close. The cursor_open event includes an action to show you the T-SQL text being executed, along with other various bits of information. The remainder of this post I'm going to show you how I setup a test to compare what Profiler and XE would capture.
Test Script
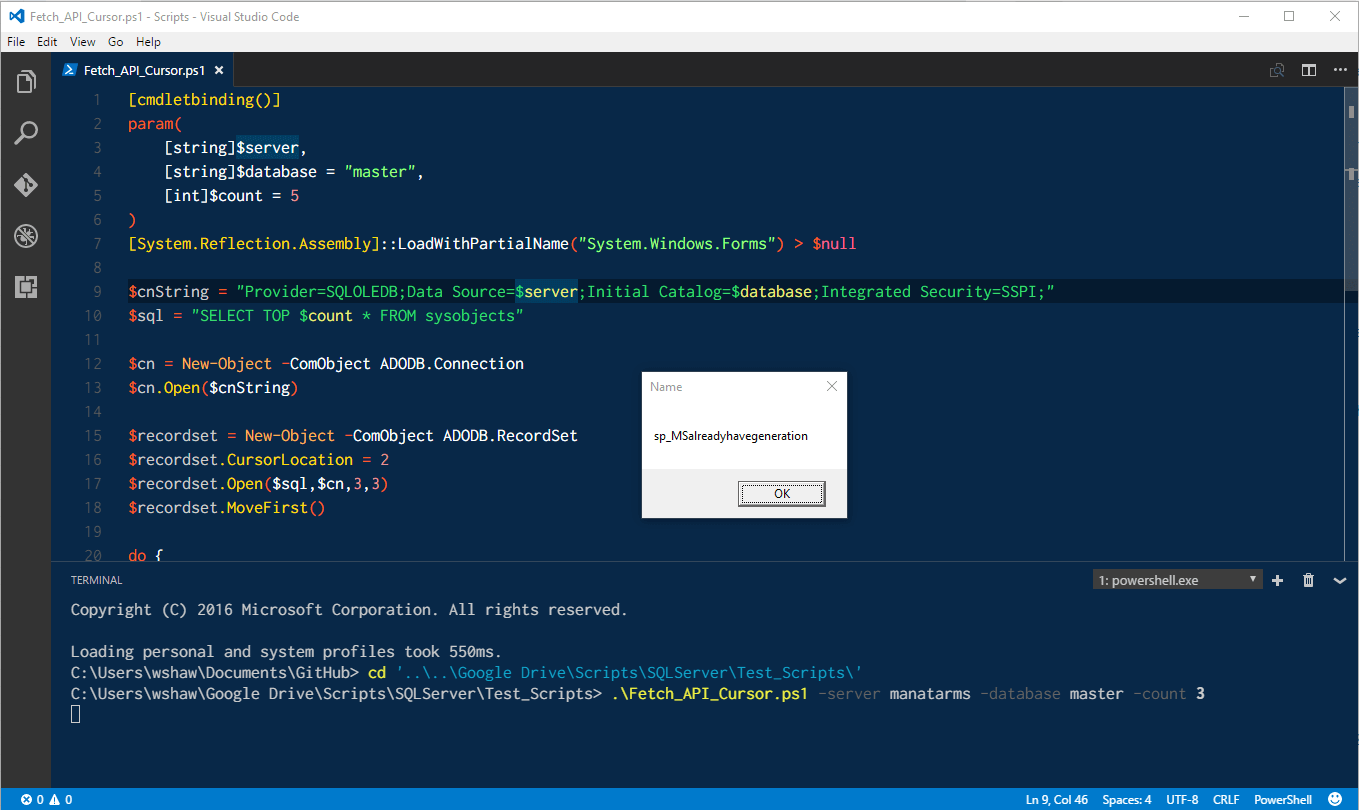
Pinal's blog post included a VB script that you can use to reproduce the issue. I don't do VB, so I rewrote it as a PowerShell script. [cmdletbinding()]
param(
[string]$server,
[string]$database = "master",
[int]$count = 5
)
[System.Reflection.Assembly]::LoadWithPartialName("System.Windows.Forms") > $null
$cnString = "Provider=SQLOLEDB;Data Source=$server;Initial Catalog=$database;Integrated Security=SSPI;"
$sql = "SELECT TOP $count * FROM sysobjects"
$cn = New-Object -ComObject ADODB.Connection
$cn.Open($cnString)
$recordset = New-Object -ComObject ADODB.RecordSet
$recordset.CursorLocation = 2
$recordset.Open($sql,$cn,3,3)
$recordset.MoveFirst()
do {
$value = $recordset.Fields.Item("name").Value;
$recordset.MoveNext()
[System.Windows.Forms.MessageBox]::Show($value,"Name",0) > $null
} until ($recordset.EOF -eq $true)
$recordset.Close()
$cn.Close()
When you run the script a message box will show the name of the "sysobject" returned, clicking OK will iterate through the number based on the count value provided. You can adjust how many are returned using the `-count` parameter.
Profiler
I want to first show you what the capture appears like in Profiler. I setup a basic trace in Profiler that uses the "Standard (default)" template, and then added in two additional events: CursorOpen and CursorClose. I execute the script above, just using a count of 5 this time, and the output from Profiler shows this information: Pretty standard to what most folks are used to seeing, the only way to see the query is that first rpc_completed event. As you can also see the cursor event classes show nothing in the text_data value.
Extended Events (XE)
Now for the juicy stuff. The XE session I have defined: CREATE EVENT SESSION [Track_api_cursor] ON SERVER
ADD EVENT sqlserver.cursor_close(
ACTION(
sqlserver.client_app_name,
sqlserver.database_name,
sqlserver.is_system,
sqlserver.session_id,
sqlserver.sql_text)
WHERE (
[sqlserver].[is_system]=(0)
AND [sqlserver].[client_app_name]=N'Steely-Eyed-Missle-Man'
)
),
ADD EVENT sqlserver.cursor_open(
ACTION(
sqlserver.client_app_name,
sqlserver.database_name,
sqlserver.is_system,
sqlserver.query_hash,
sqlserver.session_id,
sqlserver.sql_text)
WHERE (
[sqlserver].[is_system]=(0)
AND [sqlserver].[client_app_name]=N'Steely-Eyed-Missle-Man'
)
),
ADD EVENT sqlserver.rpc_completed(
ACTION(
sqlserver.client_app_name,
sqlserver.database_name,
sqlserver.is_system,
sqlserver.query_hash,
sqlserver.session_id,
sqlserver.sql_text)
WHERE (
[sqlserver].[is_system]=(0)
AND [sqlserver].[client_app_name]=N'Steely-Eyed-Missle-Man'
)
)
ADD TARGET package0.event_file(SET filename=N'Track_api_cursor.xel')
WITH (
MAX_DISPATCH_LATENCY=12 SECONDS,
TRACK_CAUSALITY=ON
)
GO
I am filtering on the application name and only looking for user sessions ("is_system=0"). You are welcome to use the live data viewer to view the data as it is captured, but remember it will not immediately show up. The buffer limit has to be reached first before it outputs the data captured to the viewer. The quickest way is just to write to and XEL file and then just query the file.
 /* Read the data */
 IF OBJECT_ID('tempdb..#XEResults') IS NOT NULL
  DROP TABLE #XEResults ;
 GO
 IF OBJECT_ID('tempdb..#XEResultsParsed') IS NOT NULL
  DROP TABLE #XEResultsParsed ;
 GO

 -- Create results table to load data from XE files
 CREATE TABLE #XEResults
 (
  [RowID] INT IDENTITY
  PRIMARY KEY,
  [event_data] XML
 ) ;
 GO

 -- Load the event data from the file target
 INSERT INTO #XEResults
  ([event_data])
 SELECT CAST([event_data] AS XML) AS event_data
 FROM [sys].[fn_xe_file_target_read_file](N'Track_api_cursor*xel',NULL,NULL,NULL) ;

 --SELECT * FROM #XEResults

 -- Query the Event data from the Target.
 SELECT [event].[value]('(@name)[1]', 'varchar(50)') AS event_name
 -- , DATEADD(hh, DATEDIFF(hh, GETUTCDATE(), CURRENT_TIMESTAMP), [event].[value]('(@timestamp)[1]', 'datetime2')) AS [timestamp]
 ,[event].[value]('(action[@name="session_id"]/value)[1]', 'int') AS [session_id]
 ,[event].[value]('(action[@name="database_name"]/value)[1]','varchar(128)') AS [database_name]
 ,[event].[value]('(action[@name="client_app_name"]/value)[1]','varchar(500)') AS [client_app_name]
 ,[event].[value]('(data[@name="object_name"]/value)[1]', 'varchar(50)') AS [object_name]
 ,[event].[value]('(action[@name="sql_text"]/value)[1]','varchar(max)') AS [sql_text]
 ,[event].[value]('(data[@name="statement"]/value)[1]', 'varchar(1000)') AS [statement]
 ,[event].[value]('(action[@name="attach_activity_id_xfer"]/value)[1]', 'varchar(200)') AS [attach_activity_id_xfer]
 ,[event].[value]('(action[@name="attach_activity_id"]/value)[1]', 'varchar(200)') AS [attach_activity_id]
 FROM #XEResults
 CROSS APPLY [event_data].[nodes]('event') AS [q] ([event])
 ORDER BY DATEADD(hh, DATEDIFF(hh, GETUTCDATE(), CURRENT_TIMESTAMP),[event].[value]('(@timestamp)[1]', 'datetime2'))
 ,[event].[value]('(action[@name="attach_activity_id"]/value)[1]', 'varchar(200)');
The cool part with extended events is turning track causality on. This is going to provide 2 additional actions that can be used to correlate which events are related to each other, and in what order they were fired. When you are capturing multiple sessions, this will help identify all the events related to a specific session (attach_activity_id_xfer) and see the sequence they were fired in (attach_activity_id). If we just look at these columns you will see what I'm talking about:
| event_name | attach_activity_id_xfer | attach_activity_id |
|---|---|---|
| cursor_open | E658AC96-9129-443F-B36F-0C5B7B16F293-0 | ABA15B0D-33B3-4A44-A9AA-42FBA00E0C45-1 |
| rpc_completed | NULL | ABA15B0D-33B3-4A44-A9AA-42FBA00E0C45-2 |
| rpc_completed | E658AC96-9129-443F-B36F-0C5B7B16F293-0 | 4B6FD168-DEB7-4ABF-BF46-55DB88E6FA5C-1 |
| rpc_completed | E658AC96-9129-443F-B36F-0C5B7B16F293-0 | 6AC684A2-8978-4FF9-8E7E-200AB9E7C622-1 |
| rpc_completed | E658AC96-9129-443F-B36F-0C5B7B16F293-0 | E71FF609-FA65-44C4-8BBD-5E66661C8149-1 |
| rpc_completed | E658AC96-9129-443F-B36F-0C5B7B16F293-0 | 74392524-F70F-466C-8EA9-C015799C8E42-1 |
| rpc_completed | E658AC96-9129-443F-B36F-0C5B7B16F293-0 | 40CC7035-1AE5-4312-8F2B-21064712AACF-1 |
| rpc_completed | E658AC96-9129-443F-B36F-0C5B7B16F293-0 | 717D8419-7CBE-4AAE-A415-AA17AB5B9D3D-1 |
| rpc_completed | E658AC96-9129-443F-B36F-0C5B7B16F293-0 | 2440E37C-D4F2-4BF0-979F-2DB7F2317411-1 |
| cursor_close | E658AC96-9129-443F-B36F-0C5B7B16F293-0 | BA3493BC-A7E0-464D-8718-57E663EA497D-1 |
| rpc_completed | NULL | BA3493BC-A7E0-464D-8718-57E663EA497D-2 |
Summary
The main purpose I want you to see is with XE you can simply use 2 events to monitor for the API CURSOR queries. You no longer have to deal with the rpc_completed and capture multiple events just to see the one with the actual query. If you are dealing with a busy system it is going to cut down on the amount of data you are capturing. In the screenshot below you can tell all of those rpc_completed events are not required, just the circled items give me all I need to know: Enjoy and happy troubleshooting. The content of this post can also be found here.
On this page
Share this
Share this
MySQL 5.7 Multi-threads replication operation tips
![]()
MySQL 5.7 Multi-threads replication operation tips
Feb 16, 2018 12:00:00 AM
2
min read
Exposing MyRocks Internals Via System Variables: Part 3, Compaction
![]()
Exposing MyRocks Internals Via System Variables: Part 3, Compaction
May 7, 2019 12:00:00 AM
19
min read
Exposing MyRocks Internals via system variables: Part 4, Compression and Bloom Filters
![]()
Exposing MyRocks Internals via system variables: Part 4, Compression and Bloom Filters
May 14, 2019 12:00:00 AM
12
min read