
Is your Prometheus performance causing your Grafana experience to suffer? Could you explain which of your tens of Grafana dashboards or users are causing performance problems in Prometheus? Let me show you how we unlocked insight into the performance of Grafana and Prometheus, allowing us to answer import service management questions such as:
- Which dashboards are actually being used?
- Who is actually using the dashboards?
- Who has been issuing poorly-performing queries?
- And which dashboard activity is causing my Prometheus instance(s) to perform poorly?
- Is it slow because someone has a dashboard showing a year’s worth of data that auto-refreshes every 30 seconds?
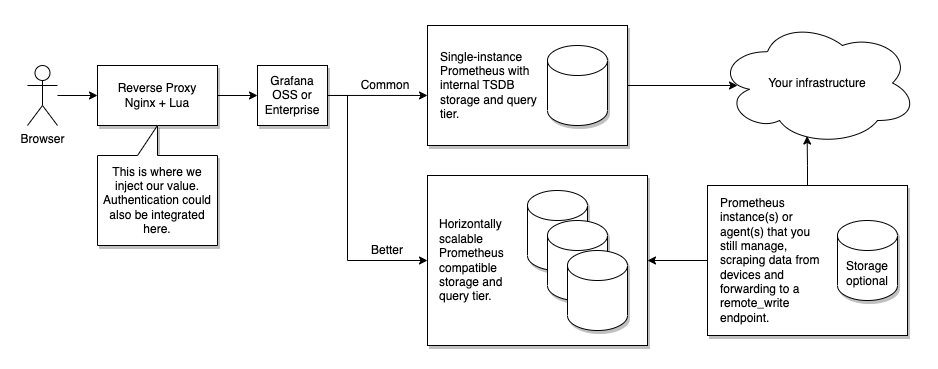
Regarding Prometheus performance at scale, you should start by ensuring you’re sending your data to a clustered solution and not to a single instance of Prometheus. Cluster solutions such as Victoria Metrics, Grafana Mimir, and others also have better management tools to help you understand your consumption and performance (e.g. cardinality explorer, slow query logging, protection at ingest-time), and may offer better functionality for retention/data tiering etc. However, they are blind as to which Grafana dashboard, panel or user is making the request, and that’s what this blog post is about.
Grafana Enterprise (or Grafana Cloud) already has some compelling functionality around dashboard analytics, so you can see who else might be looking at a dashboard and when errors are occurring. Perhaps this solution is beyond your needs for Cloud or Enterprise users. The following solution is targeted at the Open Source version of Grafana… and considering the pace of Grafana development, I’m demonstrating this with multiple versions of Grafana (namely versions 7 and 9), as they represent different query endpoints.
Architecture
To understand how this will work, it’s important to understand the typical architecture we would encounter.
The preferable solution would be as follows, each with a comment on their practicality.
- Grafana could forward the x-dashboard-id in the query to the Prometheus data source. Not practical
- Grafana could forward the user identifier in the query to the Prometheus data source. Could work using send_user_header
- Prometheus/PromQL endpoint could capture those headers as part of its logging. Not practical, at least for Prometheus
- and use that to facilitate slow query logging. It could work with additional log processing (e.g. jq)
Although this would keep the architecture the same, you would still need to consider how you would process/store/query the resulting logs. But more importantly, this won’t achieve our objectives. We can enable Prometheus query logging, but it will log every query, and we would need something to filter that if we wanted to log only slow queries. That’s achievable, but Grafana doesn’t forward request headers such as x-grafana-org, x-dashboard-id, or x-panel-id, and that’s what I’d really like to include. So injecting a solution between Grafana and Prometheus isn’t entirely useful.
What about injecting a solution between the user’s browser and Grafana? This solution would be a reverse proxy, and this is where the fun starts. To do this well means that it needs to:
- Work with GET queries in Grafana 7 and POST queries in Grafana 9.
- Use, but do not log, the grafana_session cookie and somehow translate this to the Grafana username.
- Collect and log the request headers such as x-dashboard-id (x-dashboard-uid) and x-panel-id
- and convert those into the matching dashboard and panel title, so the logs are more actionable.
- Output logs in JSON for easier consumption and later querying
- Conditionally log based on query duration
- Or surface metrics that could be scraped by Prometheus.
We’re going to need at least:
- A reverse proxy
- Some code that can be integrated into the reverse proxy
- A strategy for handling the logs (but we can ignore that for now)
- An awareness of Grafana’s API
- A testing environment that will allow us to use Grafana 7 and Grafana 9
Reverse Proxy
I looked at several solutions for the reverse proxy, such as HAProxy, Nginx, and container-native solutions, such as Traefik. The key criteria were around logging and being able to access the POST request body, which tended to exclude most options I looked at. I settled on Nginx with Lua, or more precisely, the OpenResty distribution of Nginx with the Lua module. But any server that can embed custom code should work, such as Varnish or Apache httpd. API gateway solutions may also have useful features to contribute here. Be careful to consider surrounding issues, such as support for WebSockets (which Grafana 9 does use), HTTP/2 or integration with other authentication solutions.
Lua is a programming language often used embedded within larger programs. Notably, modern versions of HAProxy, Nginx and Apache httpd all have Lua support. Its a language that is meant to be small, but you’ll find that it’s quite capable for a small language, although it certainly does have its own distinct flavour, such as 1-based arrays, regular expression language, and Unicode support… but for our purposes, it provides a comfortable solution. As Lua is typically an embedded language, we’re not just dealing with Lua, but in this case, we’re dealing with the Nginx Lua API.
When using Lua with Nginx, you might as well be using the OpenResty distribution of Nginx. You can think of it as Nginx with many other modules made available; it’s not a fork. OpenResty is the project that creates the Lua support for Nginx. I’m happy to say I used it for a similar project about ten years ago, and it worked very well then too. One of the nice things about OpenResty’s Lua support is that it includes its own version of CJSON, as well as readily available support for MySQL, Redis, memcache and more.
Lab Environment
We’re principally concerned with the configuration of Nginx (OpenResty), and we need a base configuration of Prometheus and Grafana… actually, multiple instances of Grafana; because I wish to test with different versions of Grafana at once. All components are easily obtainable using Docker Compose. The only obstacle is that I want container images that I can use on my M1 Mac (ARM64 CPU), which influenced the flavour of the OpenResty container image.
In essence, it is really quite simple, but there are a few things to note:
- A Prometheus Data Source has been ‘provisioned’ into each Grafana instance.
- Grafana dashboards have similarly been provisioned. If you wish to edit a dashboard it would be advisable to make a copy of it first within Grafana.
- Anything relating to log-shipping is out-of-scope for this lab; all the Nginx access (and error) logs are output to stdout.
- This Docker Compose configuration is emphatically not something to be considered production-grade; likewise, the Grafana and Prometheus configuration. It’s the Nginx configuration that is the thing of interest here.
- Most of my development has been done in Grafana 7.
- You’ll need Docker Compose (in newer versions of Docker Desktop, you can use it as ‘docker compose’; otherwise, ‘docker-compose’)
Let’s have a first look:
git clone https://github.com/pythiankerr/grafana-prometheus-nginx-lua

cd grafana-prometheus-nginx-lua

docker compose up --build
I’ve exposed the following ports, the most significant are:
- 8080 for Nginx; in particular:
- http://127.0.0.1:8080/grafana-proxy/debug for some debugging output
- http://127.0.0.1:8080/grafana-proxy/metrics for some Prometheus Metrics we create
- (8080 + version) for Nginx leading to Grafana version, e.g. http://127.0.0.1:8087/ for Grafana 7
If you’re using these ports for something else, you’ll want to change the ports used. (eg, changing 8080:8080 to 8090:8080 in the docker-compose.yml file)
Node-exporter and cAdvisor containers are also running, but only to have something useful to scrape. Because both are rather good at exhibiting cardinality issues in their default configurations, some versions are significantly more so than others.
Because both versions of Grafana will operate on the same hostname, their login cookie will collide, and you’ll end up invalidating your session and having to constantly log in all the time. So I’ve configured different versions of Grafana to use a distinct cookie grafana_<major-version>_session rather than the default grafana_session. You can see this in the reverse proxy configuration provided.
Log into Grafana 7; the initial username and password has the same value admin. You will have to change it (or not) on your first log-in. Navigate to the Admin > Data Sources > Prometheus > Dashboards page, and import the dashboard for “Prometheus 2.0 Stats”. This will give you a default dashboard showing all the metrics we capture for Prometheus.
Here are a few Docker Compose tips that will be useful if you want to develop this further:
- First (re)build any needed containers for the stack using
docker compose build - Then launch the entire stack in the background using
docker compose up --detach - Restart Nginx using
docker compose restart rev-proxy, remembering to first usedocker compose build rev-proxyif you changed its Dockerfile - Have another window tailing logs using
docker compose tail -f --since=0s rev-proxy. The--sinceargument prevents re-outputting old logs. - I’ll show you some more trickiness soon using
jq.
Observing Grafana Traffic
Point your browser to one of your Grafana instances, and enable your browser developer tools (typically F12). Use the ‘Network’ view (I’m using Chrome), so you can see the requests being made by your browser. See if you can find the following:
- Navigate to a dashboard (e.g. the one you just loaded). Can you find the request that loads the ‘JSON Model’ that describes the dashboard’s configuration? The URL path will look like this, and you should have a look at the Response, which is a fairly complex JSON document.
- Can you find the title of the dashboard? How about the title of each panel? What about the folder the dashboard appears in? Grafana 7 and Grafana 9 differ in how they refer to a dashboard; Grafana 7 uses the ‘id’ field, while Grafana 9 uses the ‘uid’ field.
- So when we see a request for a dashboard model, we could grab a copy of it and use it to form a table of dashboard ID (UID) to the title, and similarly for panel ID to the title.
- Whenever the dashboard reloads its data (e.g. by periodic refresh), you will see a number of queries being made. This is a significant difference in Grafana versions 7 and 9.
- In either version, you should see some interesting Request headers: see if you can find
x-grafana-org,x-dashboard-idandx-panel-id; make sure you look at the request headers and not the response headers. Grafana 9 changes this a bit, and you getx-dashboard-uidinstead and you also get x-datasource-id. - Grafana 7 uses GET endpoints particular to the type of backend, so for Prometheus you’ll see
/api/datasources/proxy/$dsid/api/v1/querywhere the last part is the Prometheus API endpoint. - Grafana 9 introduces a bulk POST endpoint
/api/ds/query, and will put all Prometheus queries that make up a panel into one fetch query to/api/ds/query - See if you can spot how to find the timeframe of a query. It would be useful to be able to determine if we’re looking at a query that was slow because it was for a timescale of a week rather than a few hours.
- So now we know a bunch of additional request headers to add to our access logging.
- In either version, you should see some interesting Request headers: see if you can find
- Note also the Referer header, which could be mined for information.
- Grafana has an Explore mode, where you make ad-hoc queries to a data source. How are these different? How could our reverse proxy determine if a request is part of a dashboard and panel or if it was someone using the Explore functionality?
- We could use this knowledge to tag those queries that were made using the Explore-mode. This is helpful because those can be full of slow queries, particularly if someone is trying to diagnose a performance issue.
- Next, look at the session cookie, which is typically ‘grafana_session’, although we’ve changed our Grafana 9 session cookie to ‘grafana_latest_session’.
- I’m not sure if this is Grafana itself, but if you’ll borrow this session cookie, make sure to also borrow the User-Agent header. Grafana does analyse this, and I have seen instances when using curl where not doing so can invalidate a session.
- Finally, click on your avatar to access your user’s profile. You should be able to see doing these consults
/api/user. We can use that same API endpoint to get the user’s login name.
Now we should hopefully have an idea of:
- what additional things we might like to log
- how we could conceive of knowing the username behind the session
- how we can recognize the API endpoints that will carry the queries we are interested in
- how we can associate each query with the dashboard and panel (or Explore mode) that made the request
- and how we could conceive of knowing the dashboard and panel titles that will be useful to put in the slow query log
Logs, Metrics and Histograms
We have the power of Lua available and access to third-party libraries. With the ability to safely maintain shared dictionaries between Nginx worker threads, we can easily use a third-party library to define, update, and surface metrics that could be consumed by Prometheus… and then surfaced by Grafana; how very ‘meta’.
Logs are (still) great; they capture the finer detail, including (potentially) high cardinality fields that shouldn’t belong in a metric label, such as which user is associated with a particular activity or the actual query.
Talking about cardinality, one issue I must address is that the cardinality of all the panels on all the dashboards in all the folders can be quite significant. Recently I worked with a client that had close to 100 dashboards in one Grafana instance, each with at least 10 panels. If we create a ‘histogram’ view of the performance, essentially counting the number of queries with performance less-than-or-equal-to to a set of, for example, 10 buckets, then that’s a potential cardinality of 10,000 series. Cardinality in the tens of thousands is already getting unwieldy. If we were to try and add a ‘user’ label, then if we allow for 100 users, then we’re talking cardinality in the order of a million. So don’t add user labels, as per best practice.
If cardinality becomes something of concern, then we have some strategies we can use:
- Ensure you only use meaningful bucket thresholds or use Prometheus relabelling drop buckets of less interest.
- Throw out the histogram _bucket metrics entirely and use the _sum and _count metrics.
- Use Prometheus relabelling to drop metrics based on the folder, dashboard or panel name.
- Consider only exposing detail to the level of a dashboard rather than a panel, which, as currently implemented, would require some code changes.
Remember to use metrics to quickly narrow down what problem might occur (what, when, where), and then leverage the logs when you need further detail (who, why).
Walkthrough
Are you excited yet? Let’s see a walkthrough! In this blog post, I’ll highlight some of the more interesting parts that are unique to this solution, but have a look at the repository for further information, and don’t forget to use the comments section of this blog.
To use Lua support with Nginx, you’ll frequently refer to the documentation on Directives and the Lua Ngx API, so you’ll want to refer to that as we encounter the Lua code.
Structure
rev_proxy/nginx/conf.d/default.conf
Detecting Explore mode can be done by using an Nginx map on a datasource request’s Referer header. The map directive comes in useful for conditional logging, including slow-request logging, which is a relatively novel feature in an Nginx configuration.
map $http_referer $grafana_source {
    default 'dashboard';
    '~https?://[^/]+/explore.*' 'explore';
}

map $request_time $datasource_request_is_slow {
    '~^0\.00[0-5]' 0;
    default 1;
}

map $request $grafana_loggable_path {
    default 1;
    '~GET /public/' 0;
    '~GET /avatar/' 0;
}
And if you think using a regular expression to match a floating-point numeric range makes you feel uneasy, I entirely agree. Nginx doesn’t support inequality operations in map statements. This could be replaced with some Lua code in a log_by_lua_* directive.
One of the things I’ve come to appreciate about Nginx over Apache is that it provides cleaner JSON logging. Although it’s still entirely possible to emit invalid JSON, it does at least support JSON style escaping, should some of your dashboard data contain a double-quote or something that would be escaped contrary to JSON’s rules.
I should warn you that I’m a fan of detail and structured log processing regarding access logging. Here I define two JSON log formats, including different information; one for data source requests and one for other requests. The data source requests are a superset, so I’ll just show that:
log_format grafana_nginx_dsquery_v0 escape=json '{'
    '"timestamp": "$time_iso8601", '
    '"remote_addr": "$remote_addr", '
    '"request_time": $request_time, '
    '"response_status": $status, '
    '"request_uri": "$request_uri", '
    '"request_args": "$args", '
    '"request_method": "$request_method", '
    '"host": "$host",'
    '"upstream_addr": "$upstream_addr",'
    '"http_x_forwarded_for": "$http_x_forwarded_for",'
    '"http_referer": "$http_referer", '
    '"http_user_agent": "$http_user_agent", '
    '"http_version": "$server_protocol", '
    '"grafana_get_query": "$arg_query", '
    '"grafana_get_start": "$arg_start", '
    '"grafana_get_end": "$arg_end", '
    '"grafana_get_step": "$arg_step", '
    '"grafana_post_body": "$request_body", '
    '"grafana_org_id": "$http_x_grafana_org_id", '
    '"grafana_dashboard_uid": "$http_x_dashboard_uid", '
    '"grafana_dashboard_id": "$http_x_dashboard_id", '
    '"grafana_dashboard_title": "$grafana_dashboard_title", '
    '"grafana_datasource_uid": "$http_x_datasource_uid", '
    '"grafana_plugin_id": "$http_x_plugin_id", '
    '"grafana_panel_id": "$http_x_panel_id", '
    '"grafana_panel_title": "$grafana_panel_title", '
    '"grafana_source": "$grafana_source", '
    '"grafana_username": "$grafana_username", '
    '"log_schema": "grafana_nginx_dsquery_v0"}';
A few things to notice about this:
- The log format is keyed with a ‘log_schema’ key, should you desire to use that in downstream log processing.
- Nginx can’t replace access_log configurations, only append to them, so there is currently duplication in the number of access_log statements spread throughout to ensure we use the appropriate JSON log format. But I think I could further tidy that by (re)setting a variable for which logging format should be used and using that as part of the conditional format.
- We make use of a number of Nginx variables, including ones that refer to certain query args (eg. $arg_query) where we get (in Grafana <9) the actual PromQL query and timeframe, etc.
- For Grafana 9, it uses POST requests, so we include that in $request_body. That’s where we see the query details. Ideally, the Lua code would extract just the parts it might need from that, but we’re not there yet.
- Finally, we set numerous Nginx variables from Lua, such as $grafana_username. These variables need to be initialized (to prevent a warning), and we do that by including a file
rev_proxy/nginx/conf/grafana-init-logging-vars.confwhich sets them to an empty string.
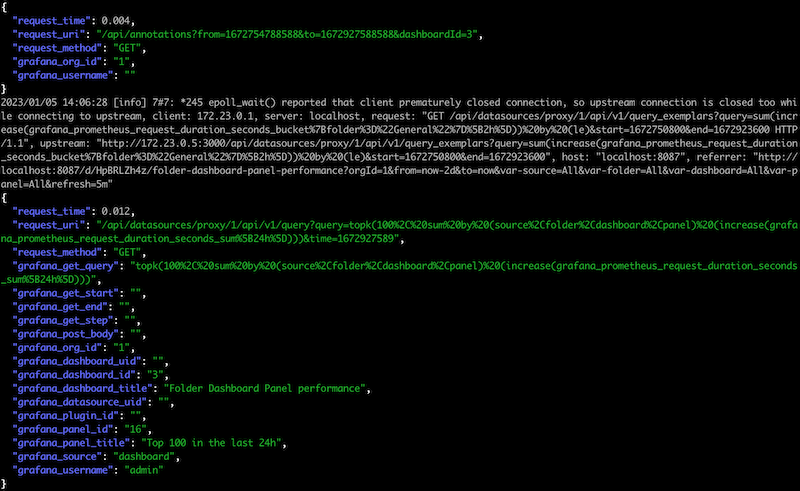
Finally, let’s be nice to everyone’s eyes. You can tail and pretty-print your JSON logs, while retaining non JSON error messages and only showing interesting JSON keys using a command such as the following. You’ll find a copy of this in the script tail-logs.sh. In layman’s terms, this gets logs from ‘docker logs’ and then uses ‘jq’ to try and parse each line as JSON. If it is not JSON then it returns and prints the line; otherwise, it will turn the object (dictionary/hash-table) into a list of key-value pairs and filter those so only keys that match a case-insensitive regular expression are retained. The output is pretty printed.
docker logs -f --since=0s prometheus-grafana-nginx-lua-rev_proxy-1 \
  | jq -R -r '
    . as $line | try (
        fromjson | with_entries(select(.key|match("(request_uri|request_method|grafana.*)";"i")))
      ) catch $line'
This produces a console display similar to the following:
The rest of default.conf comprises Nginx ‘server’ blocks. Because I support multiple versions of Grafana at once, I’ve split out each version into its own port. Reverse-proxying can be a complex topic, but it is good to know that Grafana has documentation for correctly reverse-proxying Grafana. Notably, for Grafana, version 9 includes WebSockets, but this is only used for the present operations at this time and does not impact our ability to gain insight into data source usage.
I’ve set up two types of ‘server’ blocks; one is for the internal debug URL and metrics URL and should ideally be access-restricted. The other style of ‘server’ block is for Grafana, and each version is essentially the same. I’m using ‘include’ statements to reduce duplication and using the ‘set’ directives as a mechanism to pass in parameters, notably the name of this Grafana’s session cookie and the URL of the Grafana instance relative to the reverse proxy.
# This is a server just for local diagnostics/metrics
server {
    listen       8080;
    server_name  localhost;

    allow 127.0.0.1;
    # Here I really would just like to say 'allow prometheus'
    allow 172.16.0.0/12;
    deny all;

    include "/etc/nginx/conf/grafana-init-logging-vars.conf";

    location /grafana-proxy/metrics {
        default_type 'text/plain';
        content_by_lua_block {
            prometheus:collect()
        }
    }

    location /grafana-proxy/debug {
        default_type 'text/plain';
        content_by_lua_file "/etc/nginx/lua/debug-content.lua";
    }

    access_log /dev/stdout grafana_nginx_general_v0 if=$grafana_loggable_path;
}

server {
    listen       8086;
    server_name  localhost;

    set $grafana_auth_login_cookie_name "grafana_6_session";
    set $grafana_backend_url "http://grafana_6:3000";

    include "/etc/nginx/conf/grafana-proxy.conf";

    # no access_log here, because it is set on a per-location basis
}
In this code fragment, you can already see some Lua code relating to metrics and debugging. Short snippets of code can go in a *_by_lua_block type of directive, while longer blocks of code can be referred to by file using *_by_lua_file, which makes the code more readable and enables syntax highlighting.
In this example, we’ve seen content_by_lua_* directives, which happen reasonably late in the request processing cycle, as seen in the Directives documentation.
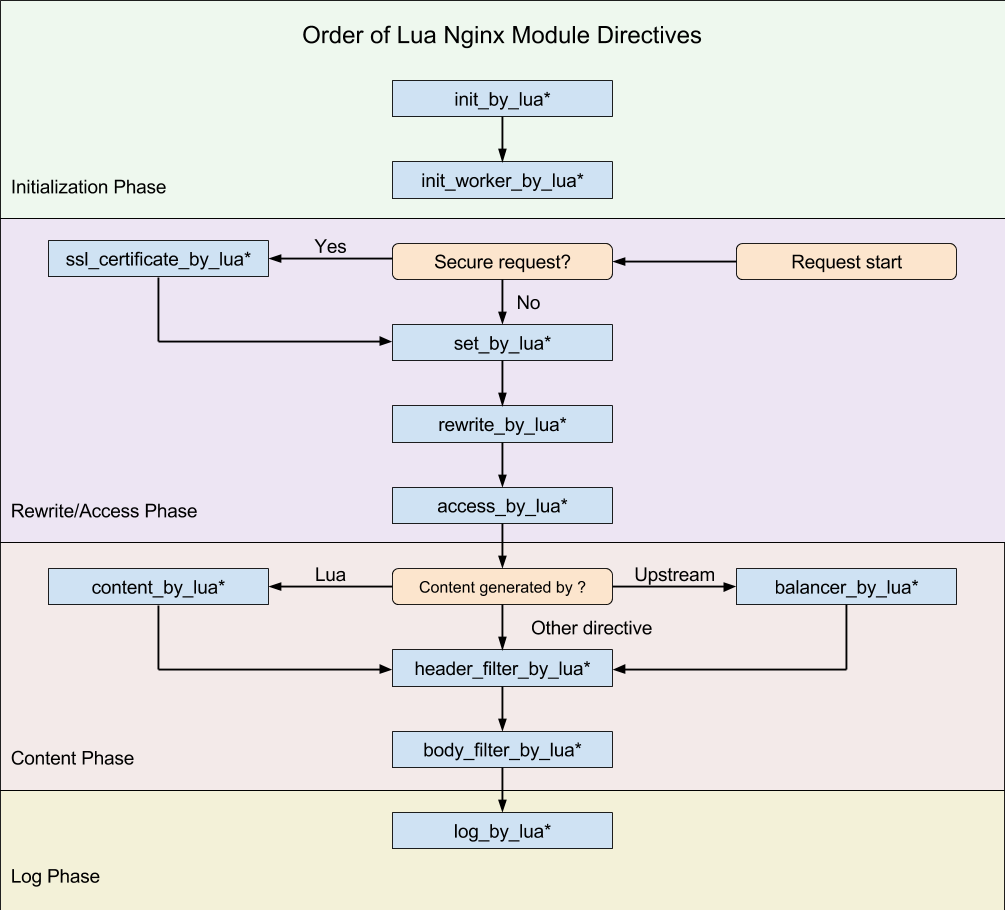
Throughout the code, we will see init_worker_by_lua*, rewrite_by_lua*, content_by_lua* and log_by_lua*. The most important thing to realise is that different parts of the API are disabled in numerous phases. Most notably, this means you can’t do things like make a network request in a lot of phases, so most of our magic happens in the rewrite_by_lua* directives, which does allow this.
Data Storage
rev_proxy/nginx/conf/grafana-init.conf
I skipped over it before, but early on in default.conf we include this file, which has the job of creating some shared memory segments that Lua can use to store data that is shared between the Nginx workers. There is no locking you need to worry about, and what goes into these shared memory segments are Lua tables. A table is the only higher-order data structure in Lua, so even lists are tables. But the values for these tables need to be strings; you can’t have a lookup table that would return another table, for example.
Each such shared dictionary needs to be configured with a size. I found on my system that anything smaller than 12k would cause an error, and Nginx would error at startup.
# Note: "nginx: [crit] ngx_slab_alloc() failed: no memory" with less than 12k.
lua_shared_dict grafana_sessions 12k;
lua_shared_dict grafana_dashboard_names 1M;
lua_shared_dict grafana_dashboard_panel_names 2M;
lua_shared_dict prometheus_metrics 10M;
We will use these shared dictionaries (tables) to store data that we look up, such as a session to username cache or to store folder/dashboard/panel title information. In processing phases where we can’t make a network request, we can still access these shared dictionaries.
Okay, so now we should understand how the Nginx configuration and logging are structured and how we shall store the data. Let’s focus now on obtaining the data, starting with the username.
Request Processing
rev_proxy/nginx/conf/grafana-proxy.conf
This file is where we find much of the logic that specifies which Grafana requests we take an active interest in. It contains some relatively boring revere-proxying boilerplate and WebSockets configuration, but the interesting thing to note is that it’s interested in three URL paths:
/api/datasources/and/api/ds/querywhich are used by Grafana <9 and 9, respectively. These are the requests we are interested in measuring./api/dashboards/uidwhich is used by Grafana to provide the ‘JSON Model’ of the dashboard. We want to obtain the dashboard id/uid and panel id as well as their respective
location ~ ^(/api/datasources/|/api/ds/query) {
    proxy_pass $grafana_backend_url;
    ...
    rewrite_by_lua_file "/etc/nginx/lua/datasource-rewrite.lua";

    access_log /dev/stdout grafana_nginx_dsquery_v0 if=$datasource_request_is_slow;

    log_by_lua_file "/etc/nginx/lua/datasource-log.lua";
}

location /api/dashboards/uid {
    proxy_pass $grafana_backend_url;
    ...
    rewrite_by_lua_file "/etc/nginx/lua/dashboards-rewrite.lua";

    access_log /dev/stdout grafana_nginx_general_v0 if=$grafana_loggable_path;
}
Username Lookup
rev_proxy/nginx/lua/datasource-rewrite.lua
This code handles all the things we do in the rewrite phase; note that you can only have one rewrite_by_lua* directive in any one Nginx scope, which is why this same Lua file ‘chunk’ handles both. Although ‘rewrite’ is mentioned, that refers to the Nginx processing phase; no actual rewriting is occurring here.
Let’s have a quick look at the username lookup:
-- Use this as a 'rewrite_by_lua_file' directive.
--
-- Enrich with username ('login') from Grafana
--

local session_cookie_name = ngx.var.grafana_auth_login_cookie_name
local session_cookie_value = ngx.var["cookie_" .. session_cookie_name]

local session_key = session_cookie_name .. "|" .. session_cookie_value
local username = ngx.shared.grafana_sessions:get(session_key)

if username == nil then

    local res = ngx.location.capture("/api/user",
        { method = ngx.HTTP_GET, copy_all_vars = true })

    if res.status == ngx.HTTP_OK and res.truncated == false then

        local resp_doc = cjson.decode(res.body)
        username = resp_doc["login"]

        local success, err, forcible = ngx.shared.grafana_sessions:set(
            session_key, username, 60)

    else
        print(
            "Lookup for /api/user returned ", res.status,
            " with truncated=", res.truncated,
            ". Body is as follows:\n", res.body)

        ngx.shared.grafana_sessions:set(session_key, "ERROR", 60) -- negative cache
    end
end

if username then
    ngx.var.grafana_username = username
end
The first thing to realise is that we don’t want to be continually making requests to Grafana to ask who the user is, so we cache it in one of the shared dictionaries we created. Note that the Nginx Lua API provides a very convenient TTL we can set and that we also implement some ‘negative caching’… meaning that if a lookup fails we remember it failed instead of asking failing requests all the time.
We retrieve the Nginx variable we set that tells us which Grafana session cookie to use. We then get the value of that cookie using the variable that Nginx sets for this purpose. Note that we don’t log or expose the session cookie, only read it and pass it to Grafana. We copy these values to temporary local Lua variables, as is recommended.
If the answer is not already cached, then we look it up. We do this using ngx.location.capture. This will create an Nginx ‘sub-request’. I’m oversimplifying here, but what this will do is make another call to Nginx, and it can do the job of making the connection, handling the request/response, potentially caching the resource etc. All we need to do is to parse the response body; after making sure it’s a successful response that was completely delivered.
In this case, what we’ve done is to ask Grafana — as if we were the user’s browser itself — the question ‘who am I?’, which Grafana answers in JSON. We parse the JSON, extract just the username (Grafana calls this the ‘login’ field) and store that data for 60 seconds in a shared dictionary.
If we succeeded in looking up a username, we set the grafana_username variable in Nginx, which we use in logging.
Dashboard Titles etc.
We first get a copy of the dashboard JSON model and extract the data we want from it, caching it for later lookup.
rev_proxy/nginx/lua/dashboard-rewrite.lua
You might think we would have convenient access to the entire (JSON) response, which we could then decode and extract our data. That would be wonderful, but performance comes first, and that means having to deal with streamed data and HTTP issues such as chunking etc. Instead, simplicity favours that we get our own copy of the dashboard using ngx.location.capture, which we then extract our data from.
-- Use with 'rewrite_by_lua_file' directive

if ngx.is_subrequest then
    return
end

local res = ngx.location.capture(ngx.var.request_uri,
    { method = ngx.HTTP_GET, copy_all_vars = true })

if res.status == ngx.HTTP_OK and res.truncated == false then

    local model = cjson.decode(res.body)

    local dashboard_id = model.dashboard.id
    local dashboard_uid = model.dashboard.uid
    local dashboard_title = model.dashboard.title
    local folder_title = model.meta.folderTitle

    local org_id = ngx.var.http_x_grafana_org_id

    local dashboard_id_lookup_key
    local dashboard_uid_lookup_key

    local info = {}
    info.folder_title = folder_title
    info.dashboard_title = dashboard_title
    local infojson = cjson.encode(info)

    if dashboard_id then -- Grafana <9
        dashboard_id_lookup_key = "org_id=" .. org_id .. "|id=" .. dashboard_id

        local success, err, forcible = ngx.shared.grafana_dashboard_names:set(
            dashboard_id_lookup_key, infojson)

        if not success then
            print("ngx.shared.grafana_dashboard_names:set failed for ", dashboard_id_lookup_key, ": ", err)
        end
    end

    -- ... similar code omitted for Grafana 9 ...

    ngx.var.grafana_dashboard_title = dashboard_title
    ngx.var.grafana_folder_title = folder_title

    -- ... similar code omitted for panel titles ...
end
One thing that maybe not immediately obvious is that the value is stored in the shared dictionary is another dictionary… at least, we’d like to. Still, we’re limited to strings, so we simply encode it using JSON.
rev_proxy/nginx/lua/datasource-rewrite.lua
Looking up the folder, dashboard and panel titles is relatively straightforward. Care should be taken to ensure we don’t set any logging variables to nil, or Nginx will continually issue warnings in the log.
--
-- Enrich with Dashboard and Panel Titles
--

local org_id = ngx.var.http_x_grafana_org_id
local dashboard_id = ngx.var.http_x_dashboard_id
local dashboard_uid = ngx.var.http_x_dashboard_uid
local panel_id = ngx.var.http_x_panel_id

if dashboard_id or dashboard_uid then

    local dashboard_lookup_key

    if dashboard_id then
        dashboard_lookup_key = "org_id=" .. org_id .. "|id=" .. dashboard_id
    elseif dashboard_uid then
        dashboard_lookup_key = "org_id=" .. org_id .. "|uid=" .. dashboard_uid
    end

    local info = ngx.shared.grafana_dashboard_names:get(dashboard_lookup_key)
    if info then
        info = cjson.decode(info)
    end

    ngx.var.grafana_folder_title = info and info.folder_title or ""
    ngx.var.grafana_dashboard_title = info and info.dashboard_title or ""

    -- ... similar code for panel removed ...
else
    ngx.var.grafana_dashboard_title = ""
end
Opportunity for Improvement
This way of obtaining dashboard data has two significant problems:
- the data is volatile, so we lose it when we restart (but not reload) the Nginx configuration, and
- many dashboards are not reloaded often (e.g. monitoring screens, unless on a carousel), so on an Nginx restart, we often won’t see the model is requested.
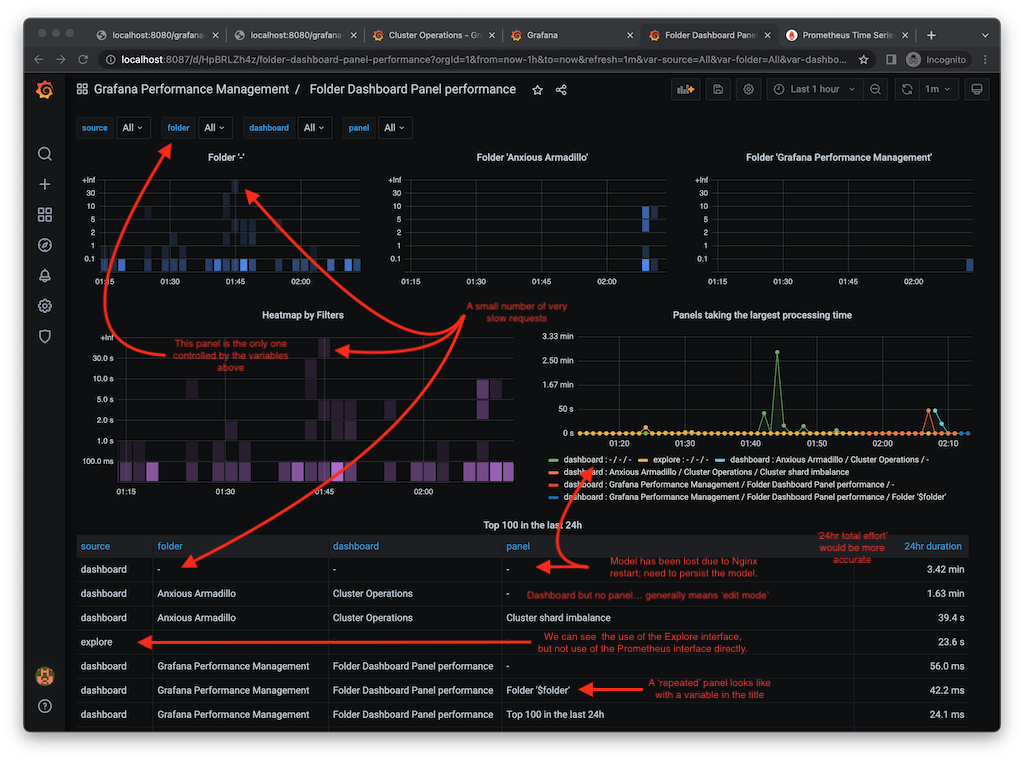
This manifests in the provided metrics dashboard as something like ‘dashboard / – / – / -‘ because we don’t know the folder, dashboard or panel titles.
We could address these failings in a couple of ways:
- EITHER we save our models persistently when we see them, such as to a Redis instance or to a local file store. We would still need to load the data into a shared dictionary, so the data is available during the Nginx Lua processing directives that disable network and filesystem access. We would still see reloads of the dashboard, so we would stay updated with dashboard versions.
- OR we set up a Grafana API service account and have it enumerate all the various dashboards. For Grafana 9, which uses x-dashboard-uid rather than x-dashboard-id, we could formulate the URL for the dashboard model and retrieve it. But you would still need to refresh the data when you see the model is retrieved.
The simplest way would be to persist the models in the filesystem; load them all using init_by_lua_file, and refresh them when you see the dashboard model being retrieved.
Metrics
rev_proxy/nginx/lua/datasource-log.luarev_proxy/nginx/conf/grafana-init.confrev_proxy/nginx/lua/init-worker.lua
rev_proxy/Dockerfile
Thanks to some excellent library support in nginx-lua-prometheus, this was done in less than a day. We simply need to create the metrics we want (in this case, I’m creating a histogram with multiple labels and some initial buckets that would benefit from changing), and then we need to update them with values (in histogram terms, ‘observe’).
-- Use with init_worker_by_lua* (perhaps should be init_by_lua?)

prometheus = require("prometheus").init("prometheus_metrics")

grafana_prometheus_request_duration_seconds = prometheus:histogram(
    "grafana_prometheus_request_duration_seconds", "Request duration down to the level of a panel",
    {"org_id", "source", "folder", "dashboard", "panel"},
    {0.1, 1, 2, 5, 10, 30})

-- Use with log_by_lua*

local org_id = ngx.var.http_x_grafana_org_id or "-"
local source = ngx.var.grafana_source or "-"
local folder_title = ngx.var.grafana_folder_title or "-"
if folder_title == "" then folder_title = "-" end
local dashboard_title = ngx.var.grafana_dashboard_title or "-"
if dashboard_title == "" then dashboard_title = "-" end
local panel_title = ngx.var.grafana_panel_title or "-"
if panel_title == "" then panel_title = "-" end

grafana_prometheus_request_duration_seconds:observe(
    tonumber(ngx.var.request_time),
    {org_id, source, folder_title, dashboard_title, panel_title})
Worth noting that we want to avoid having a label value that is an empty string because an empty label value in a metric selector (in a query) matches metrics that don’t have that label set. So by convention, we set it with a sentinel value of ‘-‘
I need Interesting Data
The struggle of effective dashboards, particularly for performance management, in a development environment such as this, you don’t have much interesting data to work with. It would be great if we didn’t have to set up such a scenario and observe it slowly in real time. We can use Prometheus’s relatively new functionality to import OpenMetrics data. The command of interest is promtool tsdb create-blocks-from openmetrics. We could create some simulated data over time using some code, then import that. The code to generate some test data is fairly simple and is largely about generating random data and dealing with times and durations nicely.
#!/usr/bin/env python3

import random
from datetime import datetime, timedelta
import sys

def scrape_data():
    '''Returns random label values and metric value, but without timestamp.

    Use to simulate a cardinality explosion that can be loaded into Prometheus.

    Let's pretend we have some system we're monitoring, and it is a sharded
    datastore of some kind. Within this system we have some type
    of client activity. Naturally, clients have very different levels of
    activity, so let's model the client with a key that is non-uniform, and
    the shard can be uniform.

    One of the goals is to ensure that a lot of the clients end up being stale.
    '''

    shard = random.randint(0, 99)
    client = random.randbytes(16).hex()[:random.randrange(1,6)]
    value = random.randint(0,1000)

    return shard, client, value

# How long (seconds) do we want to generate data for?
#
simulation_duration = timedelta(days = 7)

# How often we want our simulated data to be scraped.
# 15 seconds is too low really, but a useful default for our needs
# because that's the Prometheus default config.
#
scrape_interval = timedelta(seconds = 15)

# The documentation around 'promtool tsdb create-blocks-from-openmetrics'
# says to avoid the most recent three hours.
#
simulation_end_time = datetime.now() - timedelta(hours = 3)

# Calculate the number of scrape intervals to simulate, and the earliest scrape time
#
total_scrapes = simulation_duration // scrape_interval
simulation_start_time = simulation_end_time - timedelta(seconds = total_scrapes * scrape_interval.total_seconds())
simulation_start_time = simulation_start_time.replace(microsecond=0)

print(f"Simulation starts: {simulation_start_time}", file=sys.stderr)
print(f"Simulation ends: {simulation_end_time}", file=sys.stderr)
print(f"Scrape interval: {scrape_interval}", file=sys.stderr)
print(f"Total scrapes: {total_scrapes}", file=sys.stderr)

print("# HELP anxiety_level A gauge that should illustrate a churn problem")
print("# TYPE anxiety_level gauge")

sim_time = simulation_start_time
while sim_time < simulation_end_time:
    sim_time += scrape_interval
    timestamp = sim_time.timestamp()

    sample_count = random.randint(10,100)
    samples = {}

    for i in range(sample_count):
        shard, client, value = scrape_data()
        # We need to avoid duplicates, hence using a dictionary
        samples[shard,client] = value

    for (shard, client) in samples:
        print(f'anxiety_level {value} {timestamp}')

print("# EOF")
The generated data is in OpenMetrics format, and looks like the following; the client label either has a lot of the same (when they are short) or many unique values (when they are long).
# HELP anxiety_level A gauge that should illustrate a churn problem
# TYPE anxiety_level gauge
anxiety_level{shard="46",client="81"} 634 1672474569.0
anxiety_level{shard="69",client="e2f4af"} 634 1672474569.0
...
# EOF
Let’s see that in action. Currently, this a manual task you’ll need to do if you want the test data.
## Generate the test data

$ /usr/bin/python3 ./test_data/anxiety-level.py > anxiety-level.om
Simulation starts: 2022-12-31 21:15:54
Simulation ends: 2023-01-07 21:15:54.024699
Scrape interval: 0:00:15
Total scrapes: 40320

## From outside the container, copying the generated data into the running container.

$ docker cp ./test_data/anxiety-level.om prometheus-grafana-nginx-lua-prometheus-1:/prometheus/

## Get inside the container

$ docker exec -it prometheus-grafana-nginx-lua-prometheus-1 /bin/sh

## Make a temporary directory; it will consume about 172 MB. /prometheus is mounted
# as a volume-mount in our docker-compose.yml

/prometheus $ mkdir NEW

## Now import the data.

/prometheus $ promtool tsdb create-blocks-from openmetrics anxiety-level.om ./NEW/
BLOCK ULID                  MIN TIME       MAX TIME       DURATION      NUM SAMPLES  NUM CHUNKS   NUM SERIES   SIZE
01GP5Z71W2RPRENGTPGCRZQWQ0  1672474569000  1672480794001  1h43m45.001s  23457        19849        19849        1895194
... one line for every 2 hours by default

## Assuming it completed without complaint

/prometheus $ mv NEW/* .
/prometheus $ rmdir NEW
/prometheus $ rm anxiety-level.om
Prometheus will see those new blocks and start (maybe not immediately) combining them into larger blocks with the existing data.
Bear in mind we simulated for a period ending three hours before the current time to avoid conflicting with the ‘head block’, which is where new data is being written to by Prometheus. Now you can find the data in Prometheus…. you should be able to trivially find that a PromQL query such as ‘anxiety_level’ will get very slow.
Note: there is no ‘job’ or ‘instance’ label added for this data; if you import data this way and expect these labels to be present, you need to add them yourself.
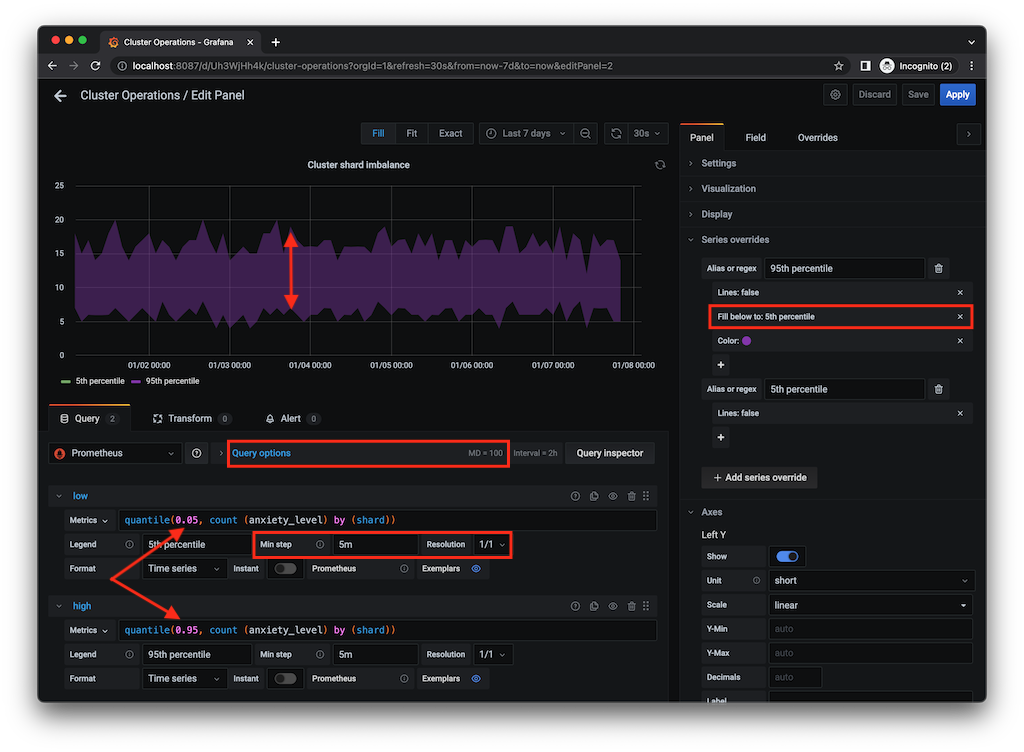
However, in our imaginary scenario, we might care to visualise how balanced our cluster is, and if we take a bit of care to specify a Min step and Max data points, we could still show the 5th and 95th percentile of the count (of clients) by shard. I’m also using a Series override in Grafana to fill only the area between the 95th and 5th percentile, creating a visualisation of the spread; the bigger the spread, the more imbalanced. You could overlay that with other quantiles, such as the average.
A Grafana Performance Management Dashboard
I’ve used Grafana and Prometheus plenty of times in the past, but admittedly histograms were not something I made much use of. It turns out that in Grafana there are a few things to be aware of to visualise histograms correctly. The dashboard I have provided makes use of three types of panels:
- Heatmaps panel type with a PromQL query using the histogram _buckets metrics, repeated for each detected folder.
- Timeseries / Histograms using the familiar _sum metrics with the likes of ‘increase’ and ‘topk’ to show where the largest load saturation is coming from. I have various Variables (using label_values functions from the Prometheus data source) to drill down into the folder, dashboard and panel. Nothing too fancy there.
- Table to show a top-N breakdown of where the load is coming from over a 24-hour period.
Cleaning Up
I’ve shown you how to generate and import data to deliberately cause a performance problem with Prometheus, so I better show you how to delete that data. This is useful to know to help clean up any performance issues you’ve identified.
To do this we make use of the TSDB Admin APIs, which need to be explicitly enabled with --web.enable-admin-api. I’ve included this (commented-out) in the docker-compose.yml
One thing I have noticed is that tools like the TSDB Status page (http://localhost:9090/tsdb-status) or ‘promtool tsdb analyze /prometheus/’, which gives cardinality statistics for the ‘head’ block only, don’t show the problems because the imported data is not in the present in the head block.
curl -is -X POST -g 'http://localhost:9090/api/v1/admin/tsdb/delete_series?match[]=anxiety_level'
curl -is -XPOST http://localhost:9090/api/v1/admin/tsdb/clean_tombstones
Disable --web.enable-admin-api when done.
If you wanted to remove all of the containers and the state created within the volumes that Docker Compose created, use the following:
docker compose ps
# make sure you're about to delete the expected containers and volumes
docker compose down --volumes
Going Further
There is more to do with this before I would consider it production ready, but it’s already well beyond a proof-of-concept stage.
- Persist dashboard models.
- For editing dashboards, harvest the edit Panel query argument when x-panel-id is not present.
- Testing with other Data Sources; after all, we haven’t really don’t much that is specific to Prometheus.
- Exploring integrations and conflicts with other reverse-proxy elements that might be used with Grafana, such as integration with OIDC authentication.
- Visualizing the time scale of queries
- Visualising user and dashboard associations
- Defining SLIs, SLOs and alerting
- Integrate logs with Grafana Loki or similar so we can query for user-activity and see what the actual query was.
- Extract useful data from the POST data source queries we currently just log.
Wrapping Up
We’ve seen a lot of content in this blog post, but we should be able to identify a number of takeaways:
- We’ve shown how to use Lua with Nginx to provide some additional value to generate high-value logs and metrics.
- We’ve shown how you can use Grafana to help you manage Grafana.
- We’ve given you a Grafana and Prometheus lab environment to explore this further.
- We’ve seen how to generate, import, use and delete Prometheus metrics.
- Before calling this production ready, we’ve identified some improvements that should be investigated.
Some performance management concerns can rightly be addressed by moving the storage and query tier away from single-instance Prometheus and moving them to a horizontally scalable managed Prometheus. But managed Prometheus solutions still need care and attention to the data that goes into them. What we’ve really illustrated is how you can manage the growing pains of Grafana and regain some important lost visibility in Open Source Grafana and beyond.
Managed IT Consulting Services
Ready to optimize your Managed Services for the future?
Share this
Share this
Using Docker to visualize MySQL performance schema
OCI Dashboard – A Single pane of Glass to your OCI Workloads – Part 1