 Sometimes, during software modernization or development with microservices architecture, a requirement for a message broker becomes apparent, and Apache Kafka seems to fit the bill. Your applications are running on Kubernetes, and you discover the Helm chart for Bitnami Kafka, which seems like an easy way to implement it.
You have deployed this new environment, but you realize maybe—it would be a good idea to monitor the performance, health and capacity of the Kafka cluster.
This article will discuss considerations to keep in mind in your observability journey.
Requirements
Our customer had the following requirements: that this Kafka cluster be hosted on their Kubernetes cluster and monitored using Datadog. Other monitoring environments can be adapted from this experience.
Kafka
There are many Kubernetes-ready implementations of Kafka available from Apache, Confluent and, in this case, Bitnami [https://bitnami.com/stack/kafka/helm]. This is a packaged version that is fairly simple to get up and running on your Kubernetes cluster:
$ helm repo add bitnami https://charts.bitnami.com/bitnami
$ helm install my-kafka bitnami/kafka
Side note: most of the time, when you see Kafka, you will also see ZooKeeper, which is used for cluster management. Newer versions of Kafka can run standalone using the Kraft protocol without ZooKeeper. Bitnami provides ZooKeeper as an integrated or separate deployment in the Helm chart, depending on your requirements, and it can have monitoring annotations as well.
There are a number of options which can be added to a “values.yaml” file based on your requirements. For the purposes of this article, we will only be discussing the metrics portion a bit later on.
Default “values.yaml”: https://github.com/bitnami/charts/blob/main/bitnami/kafka/values.yaml
JMX Metrics
Since Kafka was written in Scala, it runs in a Java virtual machine and can utilize JMX (Java Management Extensions) for its metrics. These metrics can be viewed locally (on your desktop machine) using a Java program called Jconsole.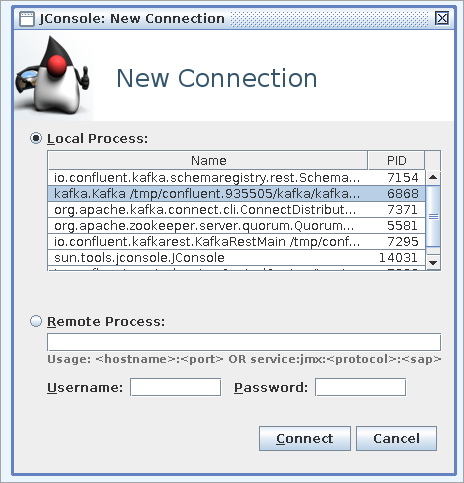
This is handy if you want to debug something that you are developing, but not very practical for monitoring and alerting in a team environment.
In order to get JMX metrics into something viewable in plain text, you will need a JMX exporter for converting to Prometheus-style metrics. Luckily, the Bitnami implementation includes an exporter, right?
I would like to step back a moment. Do you remember that one of our customer requirements was to use Datadog for monitoring? Searching Datadog’s documentation for monitoring Kafka, you will learn a lot about their agent and how it handles auto-discovery for JMX metrics, GREAT—if you are not already using an exporter. Not to disparage Datadog, but they could have been more helpful by clarifying that their JMX auto-discovery is different from Prometheus in their three-part blog!
Not to worry, we’re not done with Datadog. They happen to offer an OpenMetrics integration, which works with Prometheus-style metrics.
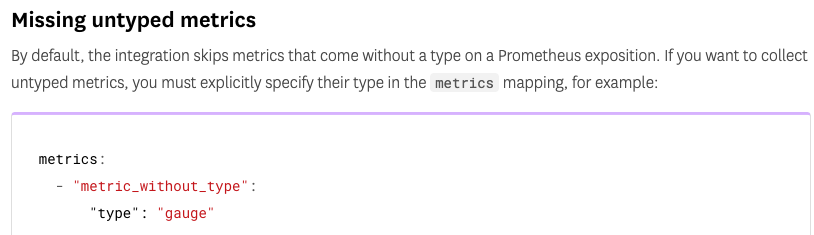
One final hurdle with Datadog and the Bitnami Kafka implementation. When Bitnami built the Prometheus configuration for this Helm chart, they made the decision to leave the metrics types undefined (gauge, counter, summary, etc). This meant that for some agents (ie: Datadog), the type would have to be manually noted for each metric.
https://github.com/bitnami/charts/blob/main/bitnami/kafka/templates/jmx-configmap.yaml vs. this implementation that includes types https://github.com/oded-dd/prometheus-jmx-kafka/blob/master/kafka-jmx-metric.yaml
I understand that leaving them untyped allows more flexibility, but Datadog OpenMetrics requires a type, or it will not display anything.
Implementation
We have gotten over the hard parts, and now we put this all together. If you have a small number of topics and/or are not worried about your Datadog bill, you can use a wildcard ("kafka_*",{"type":"gauge"}) to ship all metrics.
A word of caution, even with a small number of topics, Kafka can generate thousands of metrics, and in Pythian’s experience, only a fraction of them are important to monitor. Our consultants can advise you based on your requirements, which are most actionable and worth tracking. The following is an example of JMX metrics that were implemented.
podAnnotations:
  ad.datadoghq.com/jmx-exporter.check_names: '["openmetrics"]' #jmx-exporter is from .spec.containers[0].name in Kafka pods
  ad.datadoghq.com/jmx-exporter.init_configs: '[{}]'
  ad.datadoghq.com/jmx-exporter.instances: |
        [
          {
            "openmetrics_endpoint": "http://%%host%%:5556/ ", #endpoint from your jmx exporter
            "namespace": "<METRIC NAMESPACE DEFINED IN YOUR DATADOG>",
            "metrics": [{
                    "kafka_server_request_queue_size": {"name":"request_queue.size", "type": "gauge"},
                    "kafka_server_replicamanager_total_isrexpandspersec_oneminuterate": {"name":"replication.isr_expands.rate", "type": "gauge"},
                    "kafka_server_replicamanager_total_isrshrinkspersec_oneminuterate": {"name":"replication.isr_shrinks.rate", "type": "gauge"},
                    "kafka_server_replicamanager_total_underreplicatedpartitions_value": {"name":"replication.under_replicated_partitions", "type": "gauge"},
                    "kafka_controller_kafkacontroller_offlinepartitionscount_value": {"name":"replication.offline_partitions_count", "type": "gauge"},
                    "kafka_controller_controllerstats_leaderelectionspersec_count": {"name":"replication.leader_elections.rate", "type": "gauge"},
                    "kafka_controller_controllerstats_uncleanleaderelectionspersec_count": {"name":"replication.unclean_leader_elections.rate", "type": "gauge"},
                    "kafka_server_brokertopicmetrics_total_bytesinpersec_oneminuterate": {"name":"net.bytes_in.rate", "type": "gauge"},
                    "kafka_server_brokertopicmetrics_total_bytesoutpersec_oneminuterate": {"name":"net.bytes_out.rate", "type": "gauge"},
                    "kafka_server_delayedoperationpurgatory_purgatorysize_produce_value": {"name":"request.producer_request_purgatory.size", "type": "gauge"},
                    "kafka_server_delayedoperationpurgatory_purgatorysize_fetch_value": {"name":"request.fetch_request_purgatory.size", "type": "gauge"},
                    "kafka_server_brokertopicmetrics_total_totalproducerequestspersec_oneminuterate": {"name":"producer.request_rate", "type": "gauge"},
                    "kafka_server_brokertopicmetrics_total_totalproduceresponsespersec_oneminuterate": {"name":"producer.response_rate", "type": "gauge"},
                    "kafka_controller_kafkacontroller_activebrokercount_value": {"name": "activebrokercount", "type": "gauge"},
                    "kafka_server_kafkaserver_total_linux_disk_write_bytes_value": {"name": "disk.write.bytes", "type": "gauge"},
                    "kafka_server_kafkaserver_total_linux_disk_read_bytes_value": {"name": "disk.read.bytes", "type": "gauge"},
                    "kafka_server_delayedfetchmetrics_total_expirespersec_fetchertype_consumer_oneminuterate": {"name": "consumer.expirespersec_oneminute_rate", "type": "gauge"},
                    "kafka_server_delayedfetchmetrics_total_expirespersec_fetchertype_consumer_count": {"name": "consumer.expirespersec_oneminute_count", "type": "gauge"},
                    "java_lang_memory_heapmemoryusage_init": {"name": "jvm.heapmemoryusage_value", "type": "gauge"}
                       }]
          }
        ]
metrics:
  kafka:
    enabled: true
  jmx:
    enabled: true
In most cases, you will explicitly specify metrics, and you can name them to something more meaningful e.g.:
"kafka_server_replicamanager_total_isrexpandspersec_oneminuterate": {"name":"replication.isr_expands.rate"}
If you are unsure of a metric name, you can use Kubernetes to port forward the JMX exporter and view the results.
$ kubectl port-forward --address <local IP> pod/kafka-0 5556:5556
$ curl <local ip>:5556

# HELP kafka_topic_partitions Number of partitions for this Topic
# TYPE kafka_topic_partitions untyped
kafka_topic_partitions{topic="__consumer_offsets"} 50
# HELP kafka_topic_partition_current_offset Current Offset of a Broker at Topic/Partition
# TYPE kafka_topic_partition_current_offset untyped
kafka_topic_partition_current_offset{partition="0",topic="__consumer_offsets"} 0
. . . (can be thousands of metrics, it’s a good idea to output to a file)
Once you’ve decided on your metrics, you can apply them to your Helm chart and then configure dashboards and test.
$ helm upgrade --install kafka bitnami/kafka -f kafka-values.yaml
Check that Datadog is connected to your OpenMetrics.
$ kubectl exec -it datadog-agent-<HASH ID> -- agent status

. . .
openmetrics (2.2.2)
 -------------------
   Instance ID: openmetrics:kafka:<hash> [OK]
   Configuration Source: kubelet:containerd://<hash>
   Total Runs: 22,376
   Metric Samples: Last Run: 46, Total: 1,005,956
   Events: Last Run: 0, Total: 0
   Service Checks: Last Run: 1, Total: 22,376
   Average Execution Time : 2.996s
   Last Execution Date : <timestamp>
   Last Successful Execution Date : <timestamp>
. . .
Datadog Dashboards
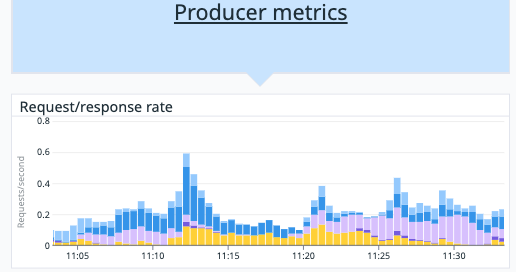
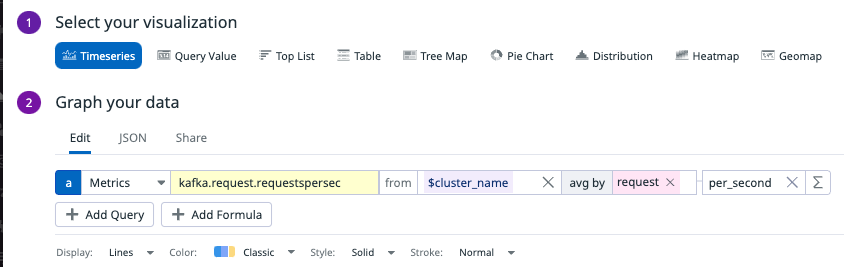
Datadog provides a prebuilt dashboard for Kafka that you can clone and customize to your liking
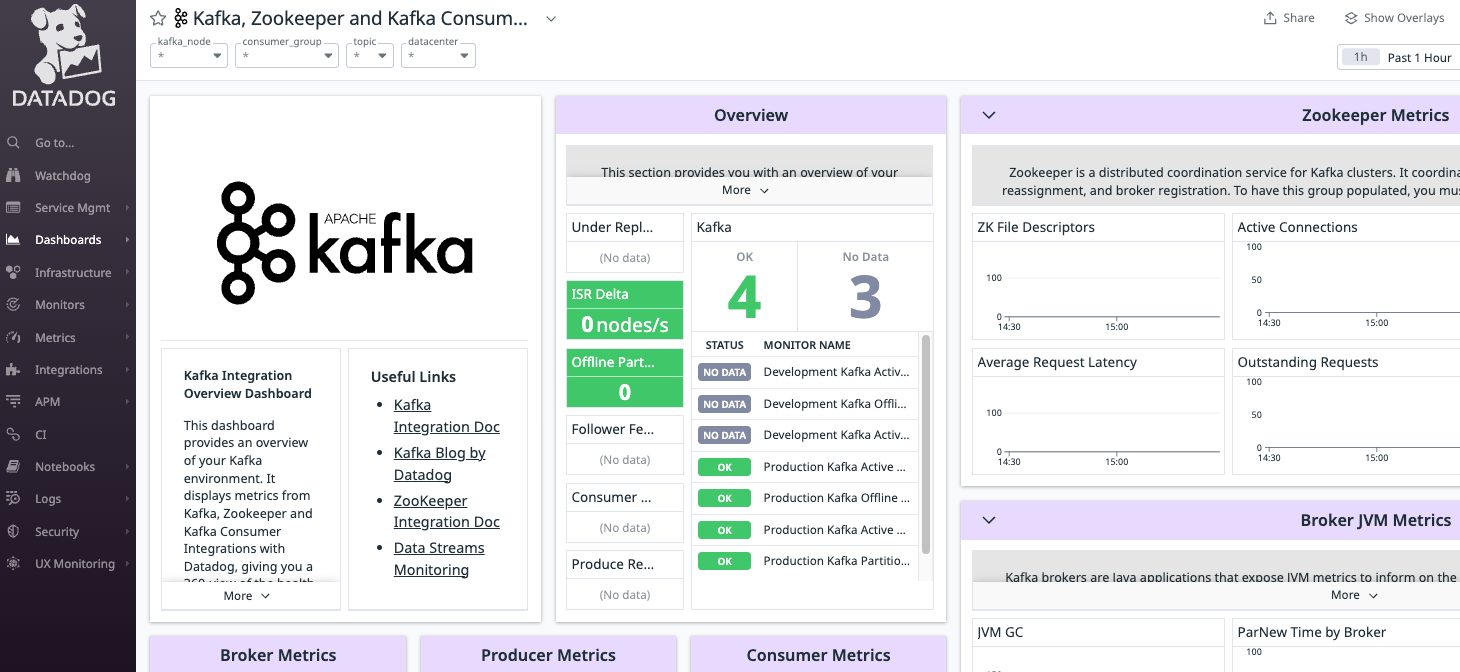
Edit any of the monitors to match the metrics you have set in the Helm chart values:
Testing
Finally, we can make sure everything works! Assuming you haven’t been trying this on your production servers, you may want to test that metrics are making their way to Datadog. The Bitnami Helm charts have kindly provided a producer and consumer within the Kafka pods that you can use to test.
$ kubectl exec -it kafka-0 -- bash
Defaulted container "kafka" out of: kafka, jmx-exporter

kafka-0:/$ export KAFKA_OPTS="-Djava.security.auth.login.config=/opt/bitnami/kafka/config/kafka_jaas.conf"  #(setup a login configuration)
kafka-0:/$ export JMX_PORT=5557 #(Note this is needed due to running the kafka-exporter that uses the 5555 port)
kafka-0:/$ /opt/bitnami/kafka/bin/kafka-topics.sh --create --topic test-topic --bootstrap-server localhost:9092 --replication-factor 1 --partitions 4

Created topic test-topic.

kafka-0:/$ /opt/bitnami/kafka/bin/kafka-console-producer.sh --broker-list localhost:9092 --producer.config /opt/bitnami/kafka/config/producer.properties --topic test-topic  #(paste in any test content)
>test in first
>testing in second
>testing in third

kafka-0:/$ /opt/bitnami/kafka/bin/kafka-console-consumer.sh --bootstrap-server localhost:9092 --topic test-topic --consumer.config /opt/bitnami/kafka/config/consumer.properties --from-beginning #(it will output what was pasted)

testing in second
test in first
testing in third
^CProcessed a total of 3 messages
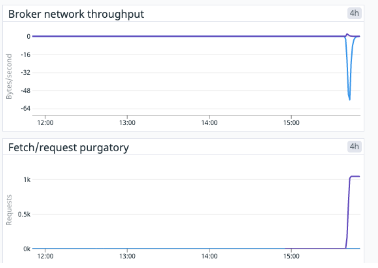
Next, go to your Datadog dashboard, and shortly, you will see some traffic appear, hooray!
Conclusion
Monitoring your Kafka clusters is important for many reasons, including health and capacity planning. Along with monitoring comes alerting, and you will need to decide what actionable thresholds are important for your environment. Depending on how you deployed Kafka, the integration with observability solutions might not be that straightforward.
The Bitnami Helm chart is an easy entry to self-host your Kafka cluster. The JMX exporter can also be used if you have your own Prometheus and Grafana monitoring. I have highlighted Datadog due to an experience with one of our customers and hope you may find this useful.
Pythian consultants can work with you to improve the observability. We are able to help out to set up your systems using Datadog or other SaaS solutions like NewRelic or ElasticCloud. We also have experience with custom deployments of Prometheus, Grafana and Elastic Stack.
Database Consulting Services
Ready to get the database consulting support you need?
Share this
Share this