Monitor Cassandra using Zabbix
Zabbix is an open-source based enterprise level monitoring solution that aims for monitoring distributed network components and servers. It supports both polling and trapping based monitoring and provides an email-based alerting capability that can respond to virtually any event of the monitored system. A web portal is also provided for viewing metrics and monitoring behavior configuration. At very high level, Zabbix monitoring solution is composed of the following core components:
- Zabbix Server
- Zabbix Agent
- Zabbix Proxy
- Zabbix Java Gateway
- Zabbix Web Interface
- Zabbix Database Interface
1. Logical Architecture of Zabbix-Cassandra Monitoring
The diagram below gives a high level architecture view of how Zabbix monitoring for Cassandra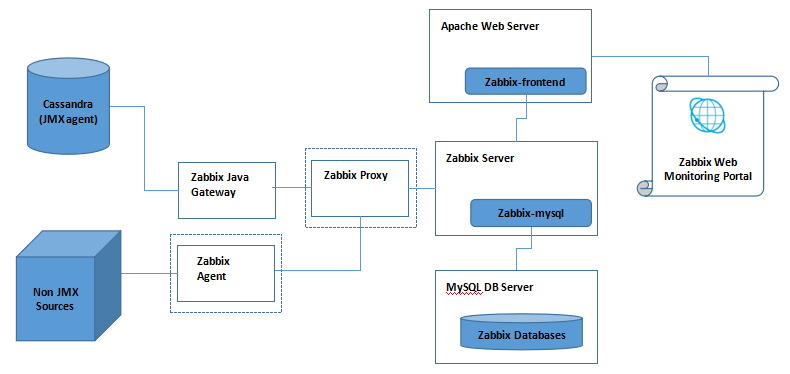 The testing environment is a virtual machine based Ubuntu 16.04.1 LTS (Xenial Xerus). The software component version involved in this diagram is as below:
- Apache Cassandra: 2.1.16 (nodetool version)
- Apache Web Server: 2.4.18 (apachectl -v)
- MySQL Database Server: 14.14 Distrib 5.7.16 (mysql --version)
- Zabbix Server: 3.2.1 (zabbix_server --version)
- Zabbix Java Gateway: 3.2.1
- Zabbix Agent: 3.2.1 (zabbix_agentd -V)
- Zabbix Proxy: 3.2.1
2. Install and Configure for Zabbix Monitoring: Server-side Components
In this section, I will go through the detailed instructions of installing and configuring the different software components that are involved. For each of the components, there are different installation methods. The method I use in this post is through Ubuntu APT package based installation method.2.1 Install Web Server, Database Server, PHP and Extentions
Zabbix front-end requites Apache web server. Meanwhile, a database server is needed to store the data collected and managed by Zabbix server. Currently, Zabbix server supports the following databases:- MySQL (5.0.3 or later)
- Oracle (10g or later)
- PostgresSQL (8.1 or later)
- SQLite (3.3.5 or later)
- IBM DB2 (9.7 or later)
 # Install Apache Web Server
 sudo apt-get install apache2

 # Install MySQL Server
 sudo apt-get install mysql-server

 # Install PHP and Required Extensions
 sudo apt-get install php7.0 php7.0-cli php7.0-common php7.0-mysql php7.0-xml php7.0-bcmath php7.0-mbstring libapache2-mod-php7.0
2.2 Install Zabbix
The instructions of installing different Zabbix components are as below: # Add Zabbix APT repository for Ubuntu 16.04
sudo wget https://repo.zabbix.com/zabbix/3.2/ubuntu/pool/main/z/zabbix-release/zabbix-release_3.2-1+xenial_all.deb
sudo dpkg -i zabbix-release_3.2-1+xenial_all.deb
sudo apt-get update
# Install Zabbix back-end for MySQL
sudo apt-get install zabbix-server-mysql
# Install Zabbix front-end
sudo apt-get install zabbix-frontend-php
# Install Zabbix Java Gateway to collect JMX metrics
sudo apt-get install zabbix-java-gateway
# Install Zabbix Agent to collect non-JMX metrics (NOTE: not used in my experiment)
# sudo apt-get install zabbix-agent
# Install Proxy for Zabbix back-end (NOTE: not used in my experiment)
# sudo apt-get install zabbix-proxy-mysq
2.3 Server-side Configuration
Once the required components are installed, the next step is to configure them properly so they can work with each other as a whole. Please note that the following configuration activities are the minimum required to make it working as a system. More advanced configurations such as those related with security or performance are beyond the scope of this blog.2.3.1 Set up the default PHP timezone
In the core PHP configuration file ( php.ini, default location at /etc/php/7.0/apache2/), provides the default time zone string that you want it to be. A full list of available PHP time zone strings can be found the following web page: https://php.net/manual/en/timezones.php date.timezone = ''
2.3.2 Configure Apache Module for Zabbix front-end
Zabbix front-end installation creates a central file (e.g. /etc/zabbix/ apache.conf) for Apache web server related configuration items. If there is any change has been made in this file, Apache web server needs to be restarted. In my experiment, the default values are used and I don't make any explicit changes. sudo service apache2 restart
2.3.3 Configure Zabbix Monitoring Database (MySQL)
The first step is to create a database named " zabbixdb" (note that the database name has to be "zabbixdb" in order for the next step to be successful) and a database user to connect to that database. Execute the following MySQL database commands in MySQL command line tool. # Create a Zabbix back-end database named "zabbixdb"
mysql> CREATE DATABASE zabbixdb;
# Create a database user, "zabbix", that has full privileges on "zabbixdb" database
mysql> GRANT ALL on zabbixdb.* to zabbix@localhost IDENTIFIED BY '
';
mysql> FLUSH PRIVILEGES;
After that, the required tables for Zabbix back-end processing need to be created in the database, as below:
 cd /usr/share/doc/zabbix-server-mysql
 zcat create.sql.gz | mysql -u root -p
2.3.4 Configure Zabbix Server back-end
Once the database is properly configured, Zabbix server needs to be configured so it can connect to the database using the created db user. This is achieved by making the following changes in Zabbix server configuration file (e.g. /etc/zabbix/ zabbix_server.conf)# host name where the database is installed DBHost=localhost # database name as created for Zabbix back-end DBName=zabbixdb # database user name to to connect to Zabbix bakc-end database DBUser=zabbix # database user password as specified when the user is created DBPassword=
2.3.5 Configure Zabbix Java Gateway
Zabbix Java Gateway is an independent component separate from a Zabbix server. It acts similarly like a regular Zabbix agent, but the only difference is that Zabbix Java Gateway is used specifically for collecting JMX metrics exposed by a Java application. The key items of Zabbix Java Gateway configuration file (e.g. /etc/zabbix/ zabbix_java_gateway.conf) are as below: # IP address that Zabbix Java Gateway listens on (for Zabbix Server connection)
LISTEN_IP="127.0.0.1"
# Port number that Zabbix Java Gateway listens on
LISTEN_PORT=10052
# Number of worker threads that Zabbix Java Gateway starts
START_POLLERS=5
After that, in Zabbix server configuration file (e.g. /etc/zabbix/ zabbix_server.conf), make the following configuration changes so Zabbix server knows how to connect to Zabbix Java Gateway
 # IP address or host name where Zabbix Java Gateway is installed
 JavaGateway=127.0.0.1

 # port number that Zabbix Java Gateway listens on
 JavaGatewayPort=10052

 # the number of process handlers within Zabbix server that are
 # started to poll from Zabbix Java Gateway threads
 StartJavaPollers=5
Please note that the configuration above is only for configuring the connection between a Zabbix Java Gateway and a Zabbix server. The connection between JMX metrics sources and Zabbix Java Gateway is configured through Zabbix Web user interface (UI). Each JMX metrics source is configured in the web UI as a Zabbix host (a device that Zabbix wants to monitor). We'll go through this part in section 3. After making the configuration changes, restart Zabbix Server and Zabbix Java Gateway:
 sudo service zabbix-java-gateway restart
 sudo service zabbix-server restart
3. Install and Configure for Zabbix Monitoring: Web UI Component
After the server side components are properly installed and configured, we can access Zabbix Web UI from the following URL: https://
/zabbix/ (e.g. https://localhost/zabbix/)
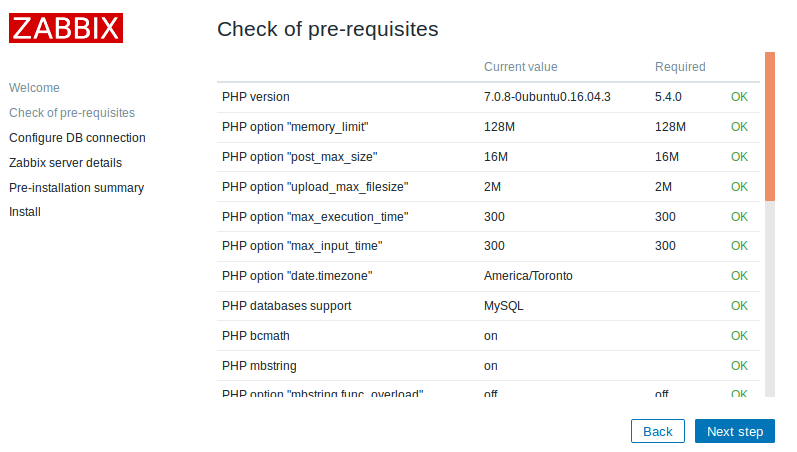
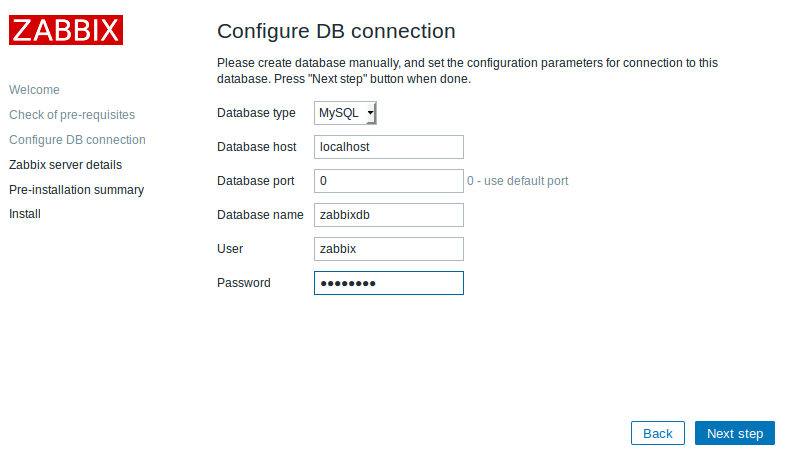
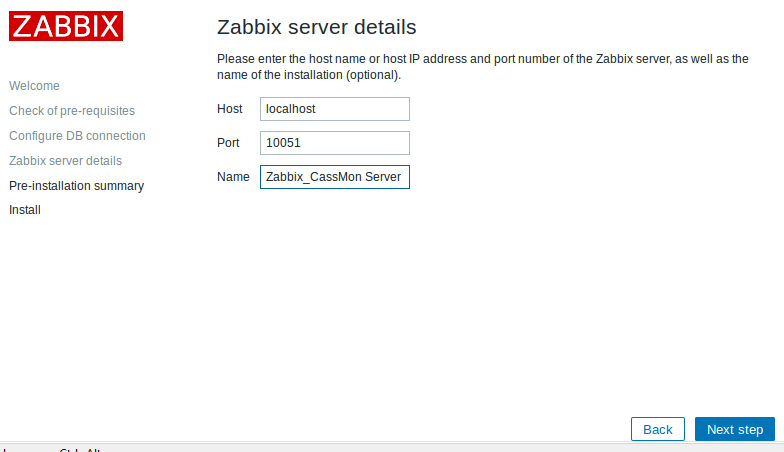
The first time access of this web UI will bring us to Zabbix front-end web configuration pages that has the following steps. The screenshot for each step is provided as below.
- Pre-requisite check
- Database configuration
- Zabbix server detail configuration
- Pre-installation summary
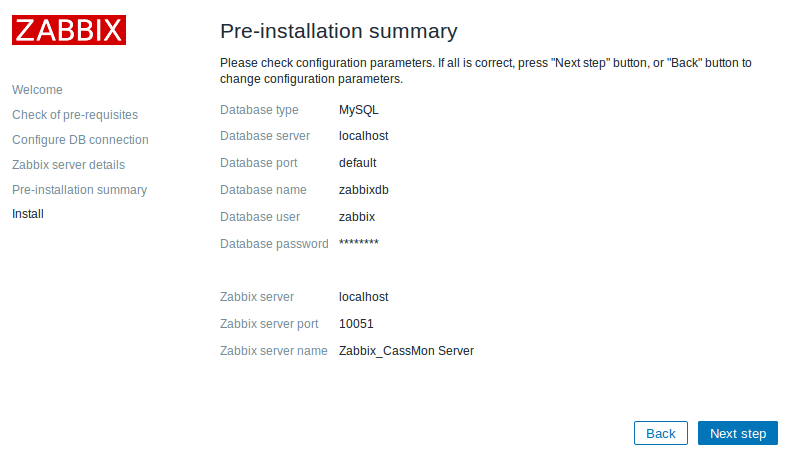
- Install
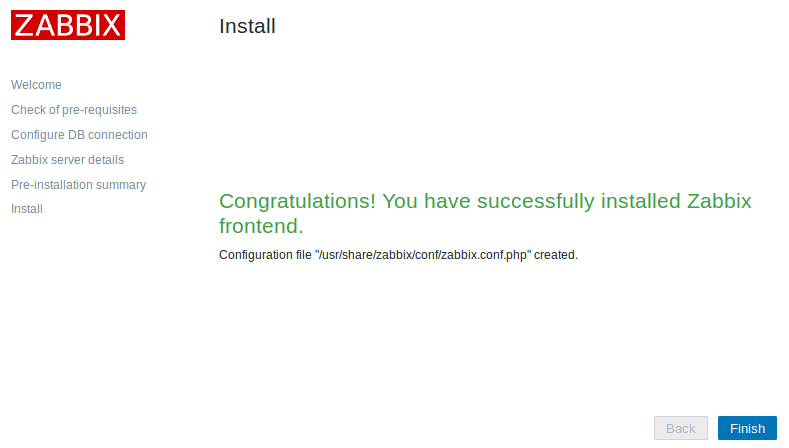
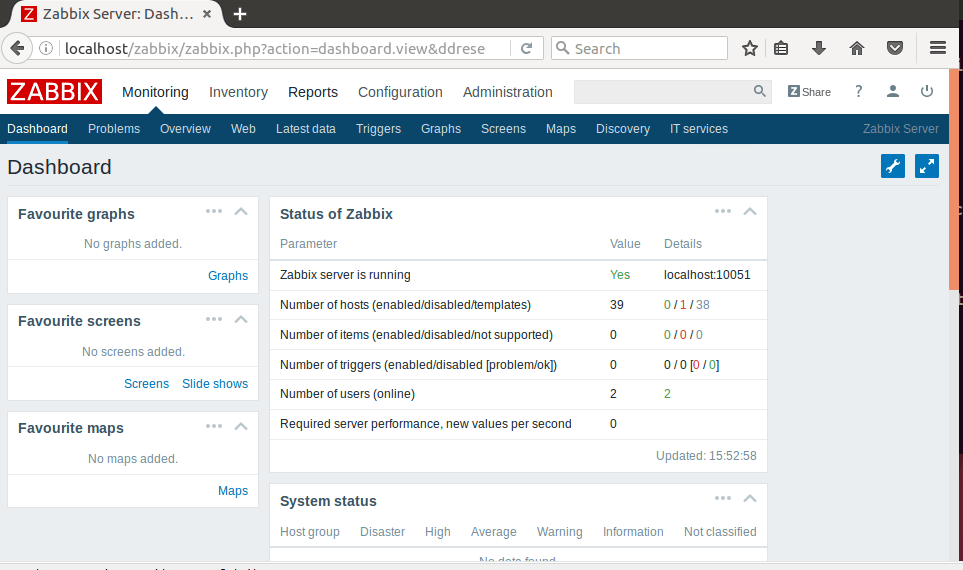
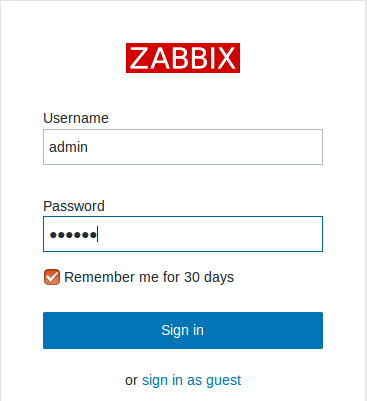 Entering the right user name and password (e.g. the default "admin/zabbix" pair), we'll land at the main Zabbix dashboard page, as below:
4. Set up Zabbix for Cassandra (JMX) Monitoring
4.1. General Approach
At this stage, we're ready to add JMX exposed Cassandra metrics for monitoring and alerting through Zabbix web UI. The high level steps of doing so are summarized as below: 1. Create a JMX-type interface on the host of interest. In my experiment, Cassandra is running locally on the same machine, with the default JMX port at 7199. So configuring the JMX-type interface for Cassandra looks like something as below: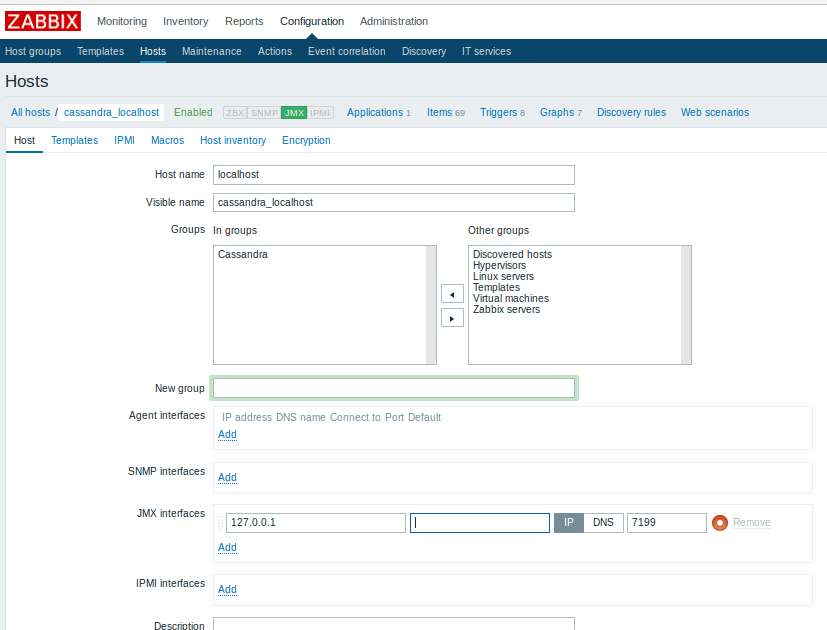 2. After the JMX-type interface on the host is defined, the next step is to add the JMX metrics of your interest to the host one by one. The following is an example of adding Cassandra metrics of "key cache capacity" as a Zabbix monitoring item.
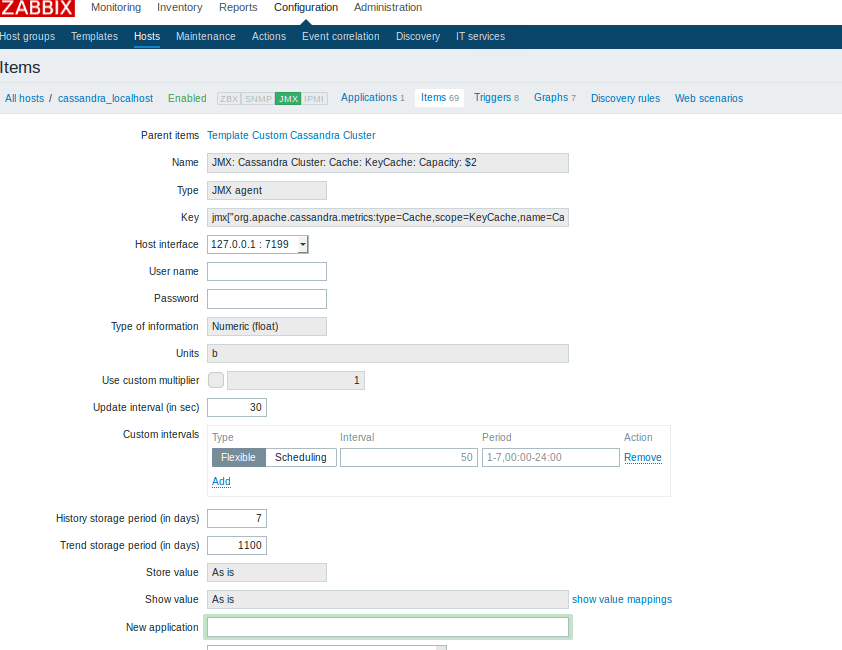
4.2. Easier Approach: Use Zabbix-Cassandra Template
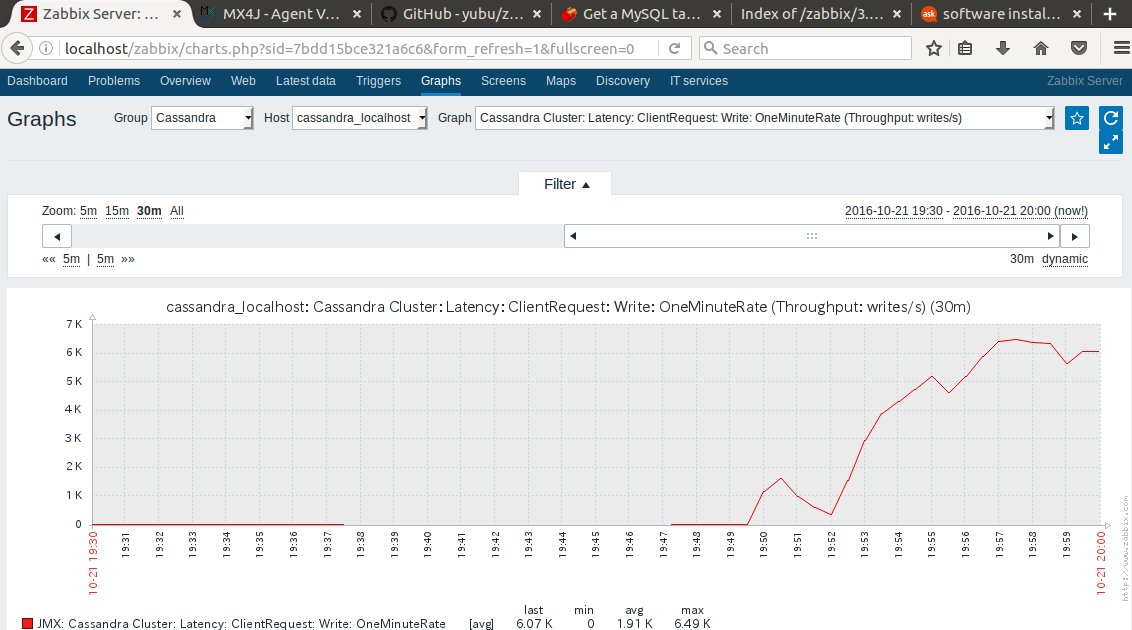
Cassandra exposes several hundreds of metrics through JMX interface. By no means it is a tedious and error-prone process to add all these metrics manually through Zabbix web UI. Luckily for us, Zabbix provides a repository of monitoring templates that can be used for a variety of monitoring scenarios and Cassandra cluster monitoring is one of such scenarios under "database" category. What we need to do is to simply: 1) Download the template as needed. The Cassandra cluster monitoring template (.xml file) can be found at here. 2) Make necessary changes that matches your own setup and import it into Zabbix from Zabbix web UI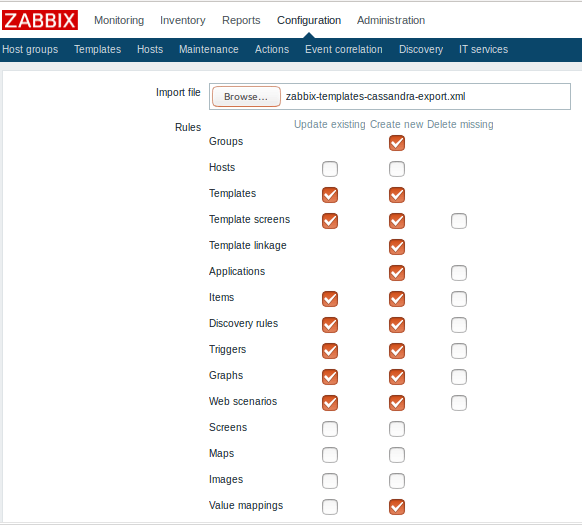 I have to point out that the provided Cassandra cluster monitoring template does NOT cover all Cassandra metrics. Instead, it includes 69 Items, 8 Triggers, and 5 Graphs examples. From these examples, you can add more items/triggers/graphs of your own interests. The screenshot below shows Cassandra client request write throughput metrics (for a cassandra-stress workload) that is monitored through Zabbix by using the items and graphs provided in the Zabbix Cassandra monitoring template.
5. Conclusion
Zabbix is a full-fledged, enterprise-level networking monitoring solution. A complete Zabbix monitoring framework covers different components that span from web based front end, web server, metrics collection agents, monitoring server and proxy, and a database server. For Java application monitoring, it also provides an out-of-the-box JMX metrics collection mechanism through Zabbix Java Gateway. In this blog post, I went through the step-by-step details of how to set up a monitoring framework to monitor Cassandra cluster metrics through Zabbix. Compared with other open-source based monitoring solutions like Graphite, it is easier to set up and doesn't require special setup on Cassandra side (except that remote JMX connection needs to be opened for remote Cassandra monitoring). More importantly, Zabbix provides out-of-the-box alerting capability that many other open-source solutions don't offer.
Cassandra Consulting Services
Ready to future-proof your SQL Server investment?
Share this
Share this
More resources
Learn more about Pythian by reading the following blogs and articles.
Watch Out When Running Out of Disk Space With InnoDB Group Replication Cluster
Monitoring your 5.7 InnoDB cluster status
OEM 13c Monitoring Features: Part 1
Ready to unlock value from your data?
With Pythian, you can accomplish your data transformation goals and more.
