OCI Dashboards is a free service that Oracle provides on its OCI platform. Using dashboards, you can get a high level picture of your current workloads, observe trends, diagnose issues and much more!
OCI provides 7 types of widgets to you on the dashboard.
- Monitoring
- Markdown
- Cost Management
- Logging Data Table
- Resource Explorer
- Billing
- Logging Chart
In this part 1 of this blog series, lets look at the first 3 types of widgets
Monitoring
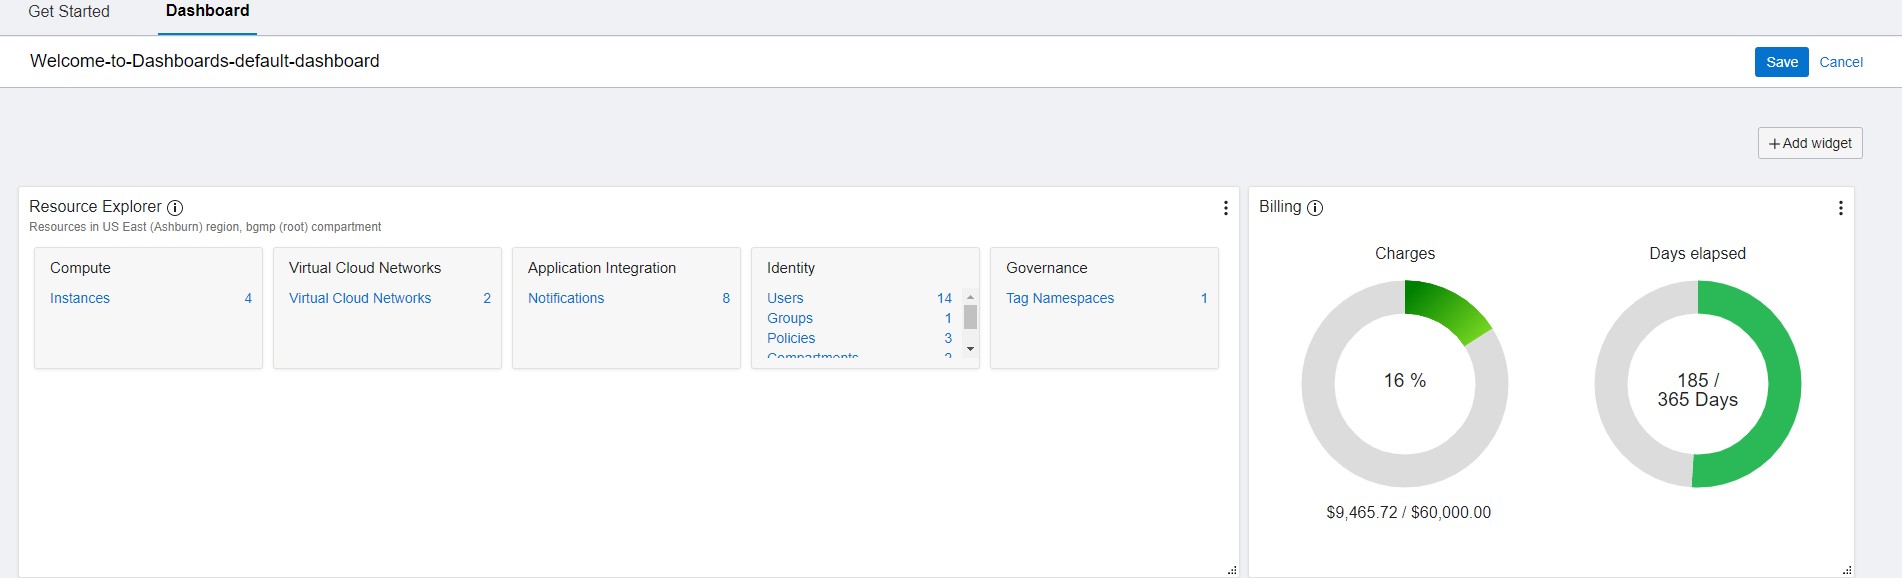
Oracle gives us a default dashboard that gives a bird eye view of OCI infrastructure with a combination of widget that Oracle feel would be good to start with.
But it also gives us more control to add/update any widgets or create new dashboards as per individual needs/role.
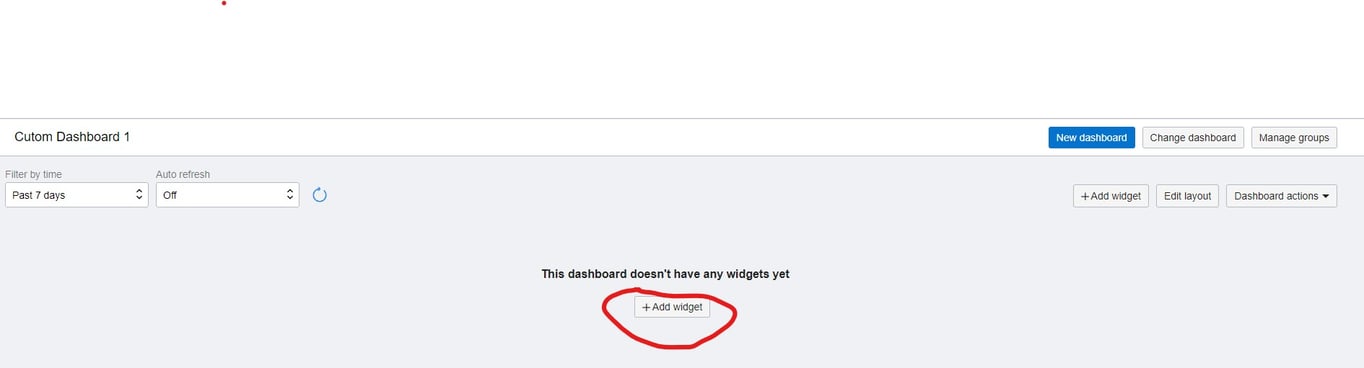
Let’s try to create a new custom dashboard by clicking on new dashboard.
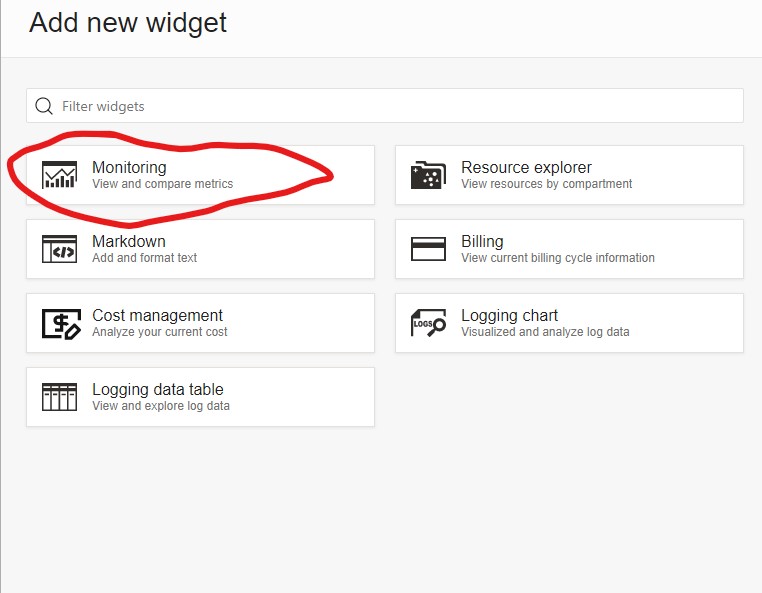
Select the Monitoring option from new widget dialog box.
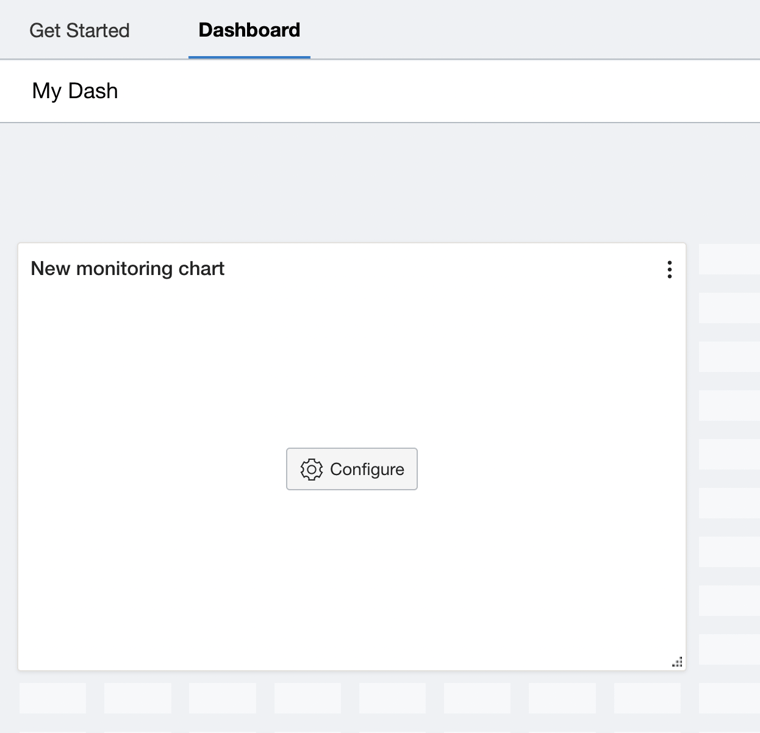
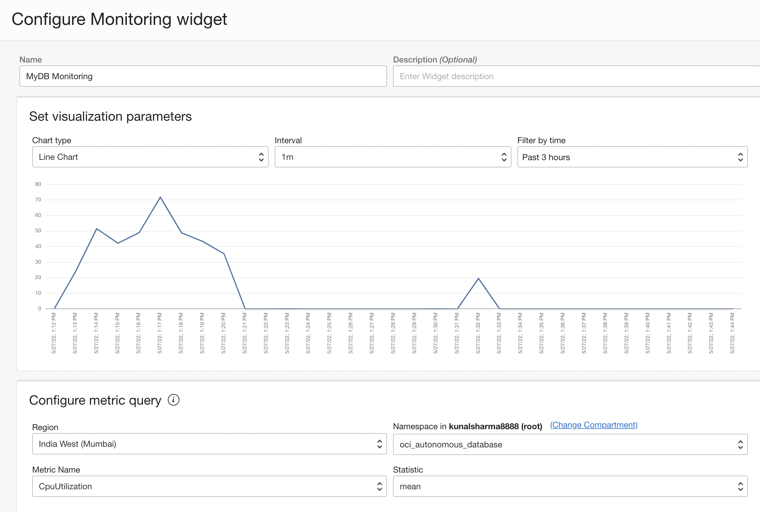
Then we can configure what kind of monitoring we want to see on our dashboard.
Now a new dialog box will gives us option for name, type of chart (bar, line, pie etc), interval value and duration.
It also gives up option for creating monitoring widget based on Region and Namespace. Then we can select what metrics we need have monitoring on.
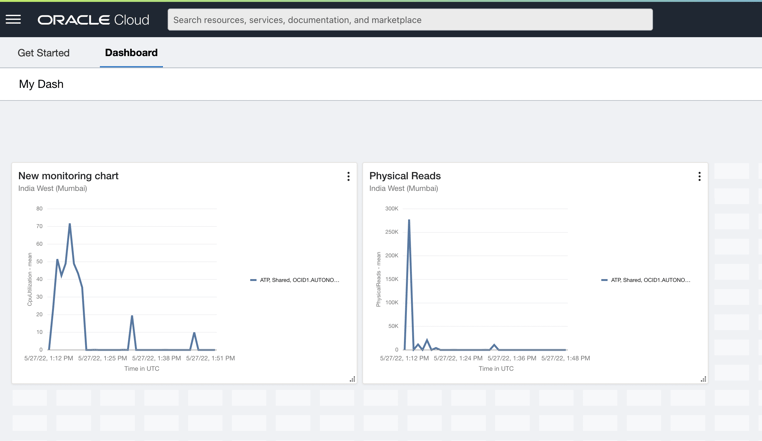
We can also multiple monitoring dashboard as per our needs. Here we created two for CPU utilisation and Physical reads on ADB.
Cost Management Widget
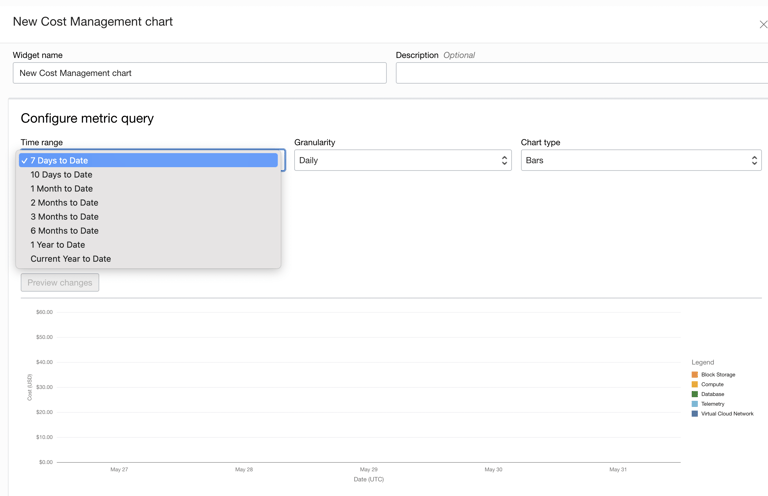
Administrators and users with appropriate permission can view the cost management widget. The cost management widget helps you track and optimize your Oracle Cloud Infrastructure spending by generating charts and reports of aggregated cost data.
The Cost analysis overview includes more information about the Cost Analysis tool and detailed descriptions of the cost analysis query field used by this widget.
It have granular control of time range and Chart type.
It also help us understand the expense based on resource with resource type as legends on the graph.
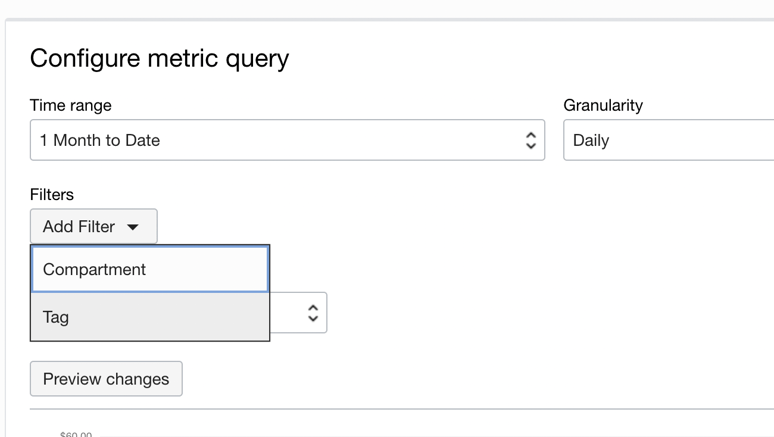
Here we can have more visibility of cost based on compartment and tag.
It will help us show it with details on where the actual money is being used.
Oracle Database Consulting Services
Ready to optimize your Oracle Database for the future?
Share this
Share this

Exploring the New OBIEE 10.1.3.4 Samples Sales Application & Data
Using Docker to visualize MySQL performance schema