Nowadays monitoring the IT environment is one of the most complex, and important, tasks in any corporation.
OEM is a powerful and highly customizable monitoring tool, I’ll show how you can make the most of it.
I’ve covered the basics of OEM monitoring in a series of posts
OEM 13c Monitoring Features – Part 3, Reports Based on Metric Data
OEM 13c Monitoring Features – Part 5, Best Practices and Automatic Incident Creation
Now I’m going to describe a few advanced aspects and critical configurations that you should perform to ensure you’re infrastructure is being properly, and constantly, monitored.
Target’s properties
To make the most of OEM’s monitoring capabilities, you should update the target’s properties accordingly.
One of the most important properties when working with groups is the “Lifecycle status”, which indicates to which environment the target belongs (Development, Testing, Production, Mission Critical, or Staging).
To give some extra growth room to OEM, I’d recommend also using the “Line of business” property to indicate either the actual line of business of the target, or the name of a parent company, which can be specially useful while merging assets from different companies into the same monitoring system.
These properties can be manually changed by going to the desired target, then selecting “Target Setup -> Properties” on the main target menu.
Change multiple targets at once
To change properties for several targets at once it’s easier to use SQL to generate the “emcli” commands on the repository database to help facilitate this step.
First, log into the OEM Repository Database, with a user that has access to the SYSMAN views.
The following query generates the “emcli” commands required to change the target’s “Line of Business” property to “CORP”:
SELECT './emcli set_target_property_value -property_records="' || t.target_name ||
':' || t.target_type ||
':Line of Business:CORP"'
FROM sysman.mgmt_targets t
WHERE target_name LIKE 'ORDB%';
This one will generate the commands to adjust the “Lifecycle status” according to the type of the target.
In my test environment I only had a couple of databases, for a live environment you’ll need to adjust the queries criteria according to your naming conventions and you might need to filter based on the target type, in that case use the second query:
SELECT './emcli set_target_property_value -property_records="' || t.target_name ||
':' || t.target_type ||
':Lifecycle Status:' ||
FROM sysman.mgmt_targets t
WHERE UPPER(target_name) LIKE 'ORDB%'
AND target_type IN ('oracle_dbsys','oracle_database');
After you have all the commands you can simply execute them, but first you need to use “emcli” to log in to the repository database as follows:
[oracle@emcc bin]$ ./emcli login -username=sysman
Enter password

Login successful
Once logged in just copy and paste the commands generated by SQL*Plus:
[oracle@emcc bin]$ ./emcli set_target_property_value -property_records="ORDB001D:oracle_database:Lifecycle Status:Development"
Properties updated successfully
[oracle@emcc bin]$ ./emcli set_target_property_value -property_records="ORDB001D_sys:oracle_dbsys:Lifecycle Status:Development"
Properties updated successfully
[oracle@emcc bin]$ ./emcli set_target_property_value -property_records="ORDB001D:oracle_database:Line of Business:CORP"
Properties updated successfully
[oracle@emcc bin]$ ./emcli set_target_property_value -property_records="ORDB001D_sys:oracle_dbsys:Line of Business:CORP"
Properties updated successfully
By correctly setting target’s properties we can take advantage of OEM’s different grouping strategies.
Groups
There are three types of groups in OEM: Regular groups, Dynamic Groups, and Administration Groups.
- Regular groups, as the name implies, are ordinary, targets should be manually added to these groups;
- Administration groups are a special type of group used to fully automate application of monitoring and other management settings;
- Dynamic groups, which are much like regular groups with the fundamental difference that targets are automatically added based on the group’s criteria, which is defined during its creation.
Administration groups
Administration Group’s main purpose is to automate the application of management settings, such as monitoring settings or compliance standards. After you create the administration groups and define target’s properties, upon addition, those targets will be automatically placed in the appropriate group and OEM will push these settings automatically to the new target.
As defined by Oracle:
“Administration groups are a special type of group used to fully automate application of monitoring and other management settings targets upon joining the group. When a target is added to the group, Enterprise Manager applies these settings using a template collection consisting of monitoring templates, compliance standards, and cloud policies. This completely eliminates the need for administrator intervention.”
(Source: Enterprise Manager Cloud Control Administrator’s Guide)
Although Administration Groups simplify management of monitoring settings it has some limitations, for example, targets can belong to at most one administration group and Administration groups cannot contain Dynamic groups.
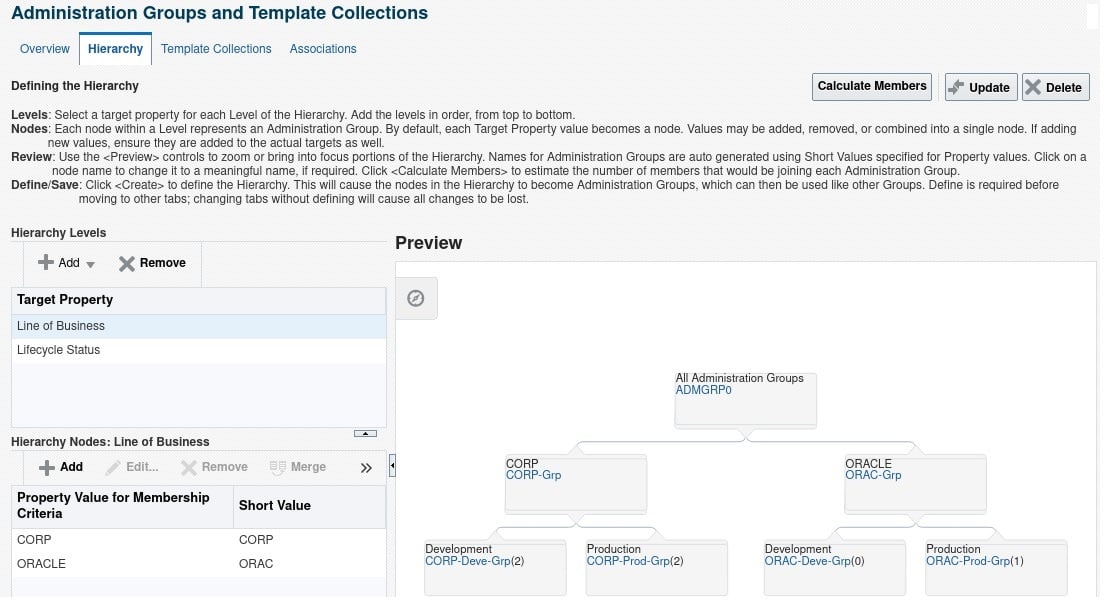
Here’s an example of an Administration group using two hierarchy levels, as defined by the properties “Line of Business” and “Lifecycle Status”:
I have registered three databases in my OEM lab:
- DB: emrepus, Line Of business: ORACLE, Lifecycle status: Production
- DB: ORDB001P, Line Of business: CORP, Lifecycle status: Production
- DB: ORDB001D, Line Of business: CORP, Lifecycle status: Production
You should be extra careful when defining the hierarchy levels as changes to these levels can take a lot of time to be processed.
Oracle automatically creates all the groups based on the hierarchy levels.
The order of the properties in the hierarchy levels is extremely important, as this will determine how child groups will be organized. If you define the first level as the “Lifecycle status”, we would have all “Production” targets within the parent “Production” group, and later we would have these targets split into child groups as defined by the “Line of Business” property, in this case the group organization would be completely different than the one displayed previously.
Dynamic groups
As opposed to Administration groups, which are focused on automatically applying monitoring settings, Dynamic groups can be used to manage many targets as a single unit. With administration groups each target can belong to only one group, with dynamic groups each target can belong to any number of groups.
Note that you cannot include a static group as a member of a dynamic group.
Oracle introduced Dynamic groups in OEM 12c. These groups allow you to automatically assign members based on the target’s properties.
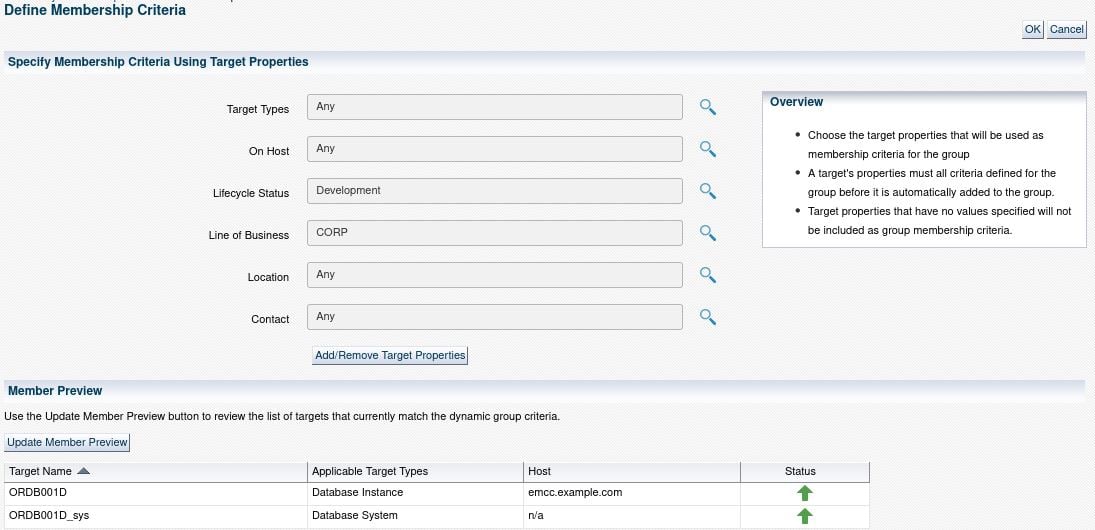
Unlike administration groups where you define the hierarchy levels, with dynamic groups you’ll specify the member criteria. Therefore we’ll have to create one group for each combination of “Line of business” x “Lifecycle status”.
Here’s an example of the CORP-DEV group, which will include all “Development” targets that have the “Line of Business” property set to “CORP”:
Monitoring templates
OEM’s alerts are based on collected metrics, such as CPU utilization, Tablespace free space, etc.
OEM uses Monitoring templates to simplify metric / threshold management for each type of target.
To create a template navigate to “Enterprise -> Monitoring -> Monitoring Templates”
Below is an example of a very basic monitoring template, to gather only the Database Status and Tablespace free space:
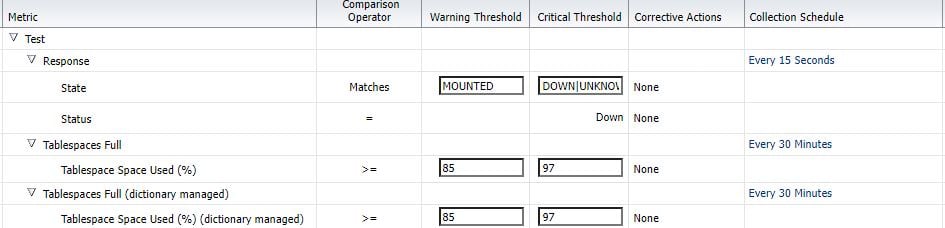
There are 2 distinct metrics to check if a database is up or down: State and Status, that’s because OEM handles these separately, while “Status” is a “Target Availability” event, “State” is a simple “Metric alert” one. We’ll discuss these differences in the “Incident Rules” section below.
You should create a set of monitoring templates according to your needs, usually there’s one template for each target type x environment.
It’s mandatory to review all the metrics and their thresholds, as well as removing unused metrics to avoid running unnecessary checks.
Applying template to targets
You can apply templates manually using Dynamic Groups, or automatically through Administration Groups.
When using Dynamic Groups, you’ll have to manually push the template to newly added targets as well as template updates to all required targets. This is when Administration groups come in handy, after creating the groups you’ll just have to create template collections and associate it with the administration groups.
Then Oracle will automatically push these templates to newly added targets as well as when there’s a template update.
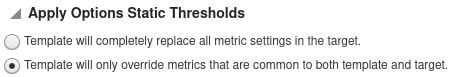
When applying a template you can completely replace all the metrics or simply update the metrics that already exist.
Now that we have the monitoring templates and groups in place, we can associate templates with groups.
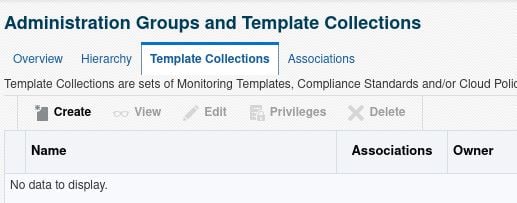
To associate the template with the administration group, go to the group page and click on the “Template Collections” tab, then click the “Create” button:
Create one template collection for each combination of “Line of business” x “Lifecycle status” and add all the monitoring templates for that particular lifecycle status:
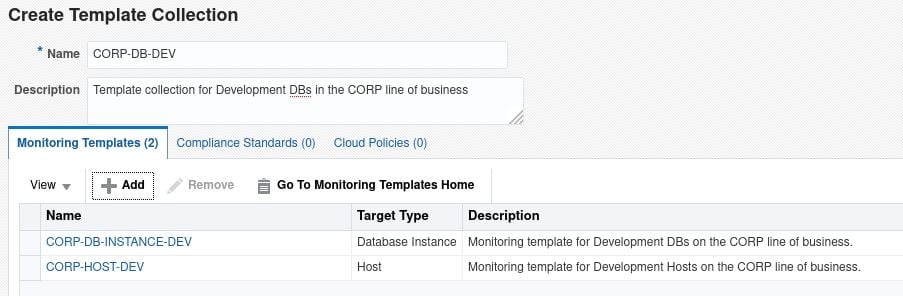
I’m only adding monitoring templates for “Hosts” and “Database Instances”, but in a live environment you should have one template for each target type.
After you create the template collections you can associate it with any level of our administration groups, to do it go to the “Associations” tab.
Select the group to which you’d like to associate the template collection, then click on “Associate Template Collection” button:
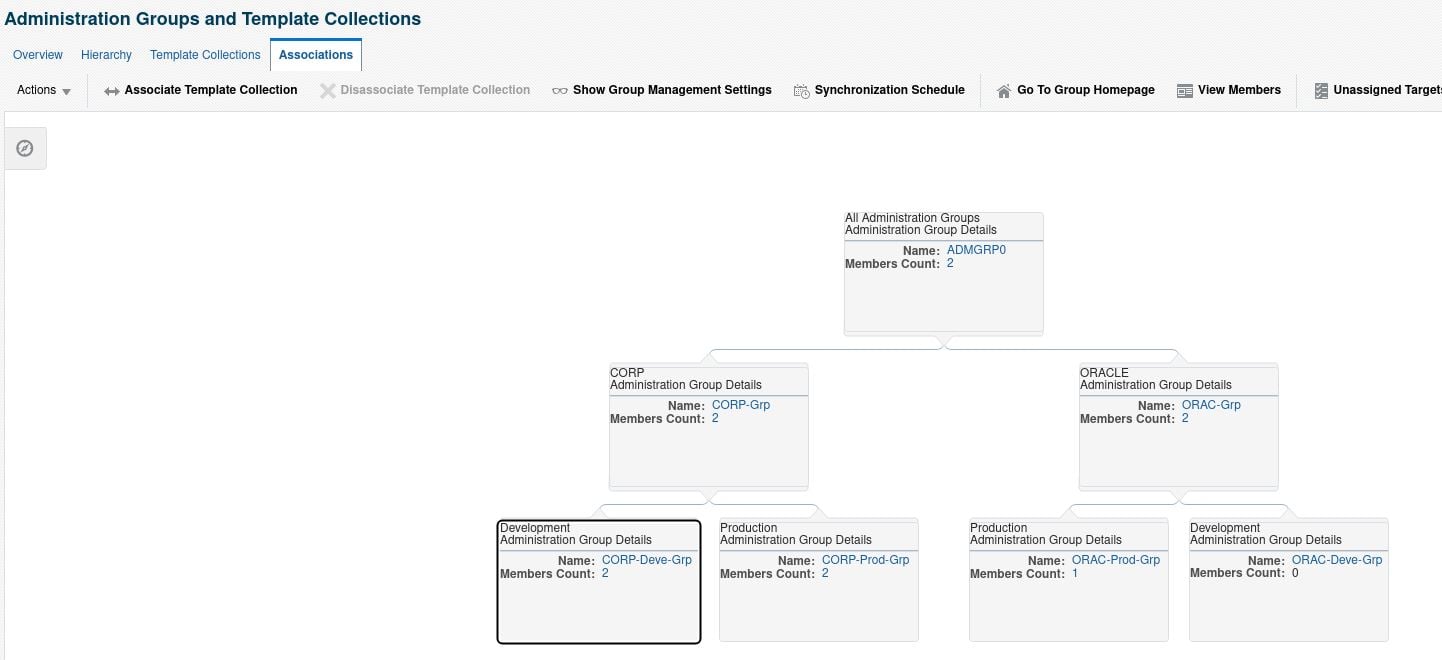
Select the desired template and save it.
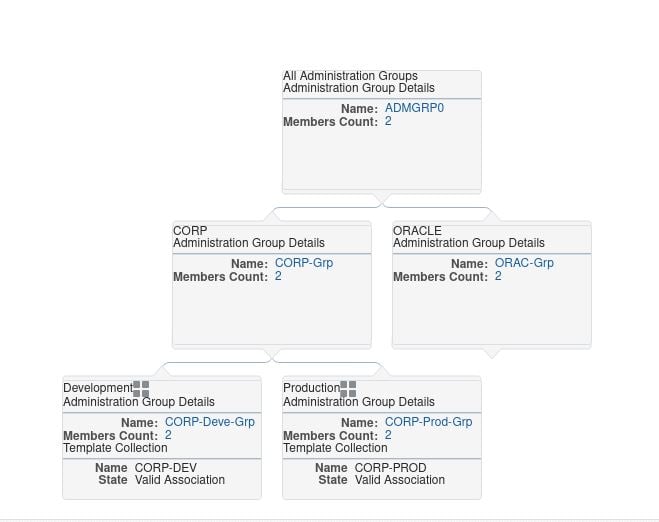
Once you have associated a template with a group it will show in the hierarchy:
Once you made the association OEM will begin to push the monitoring templates to all members of the group.
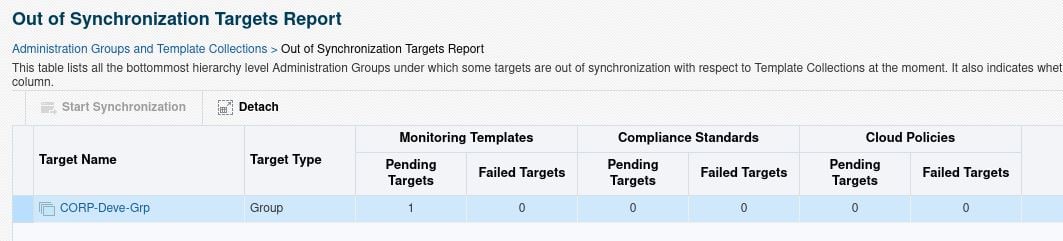
If this operation fails, you can check the issues in the “Out of Synchronization Targets Report”.
If you have any “out-of-sync” groups, you can click the “Start synchronization” button to try and re-synchronize its targets:
You can also check details for each group by clicking the Group’s name, which brings you to its home page:
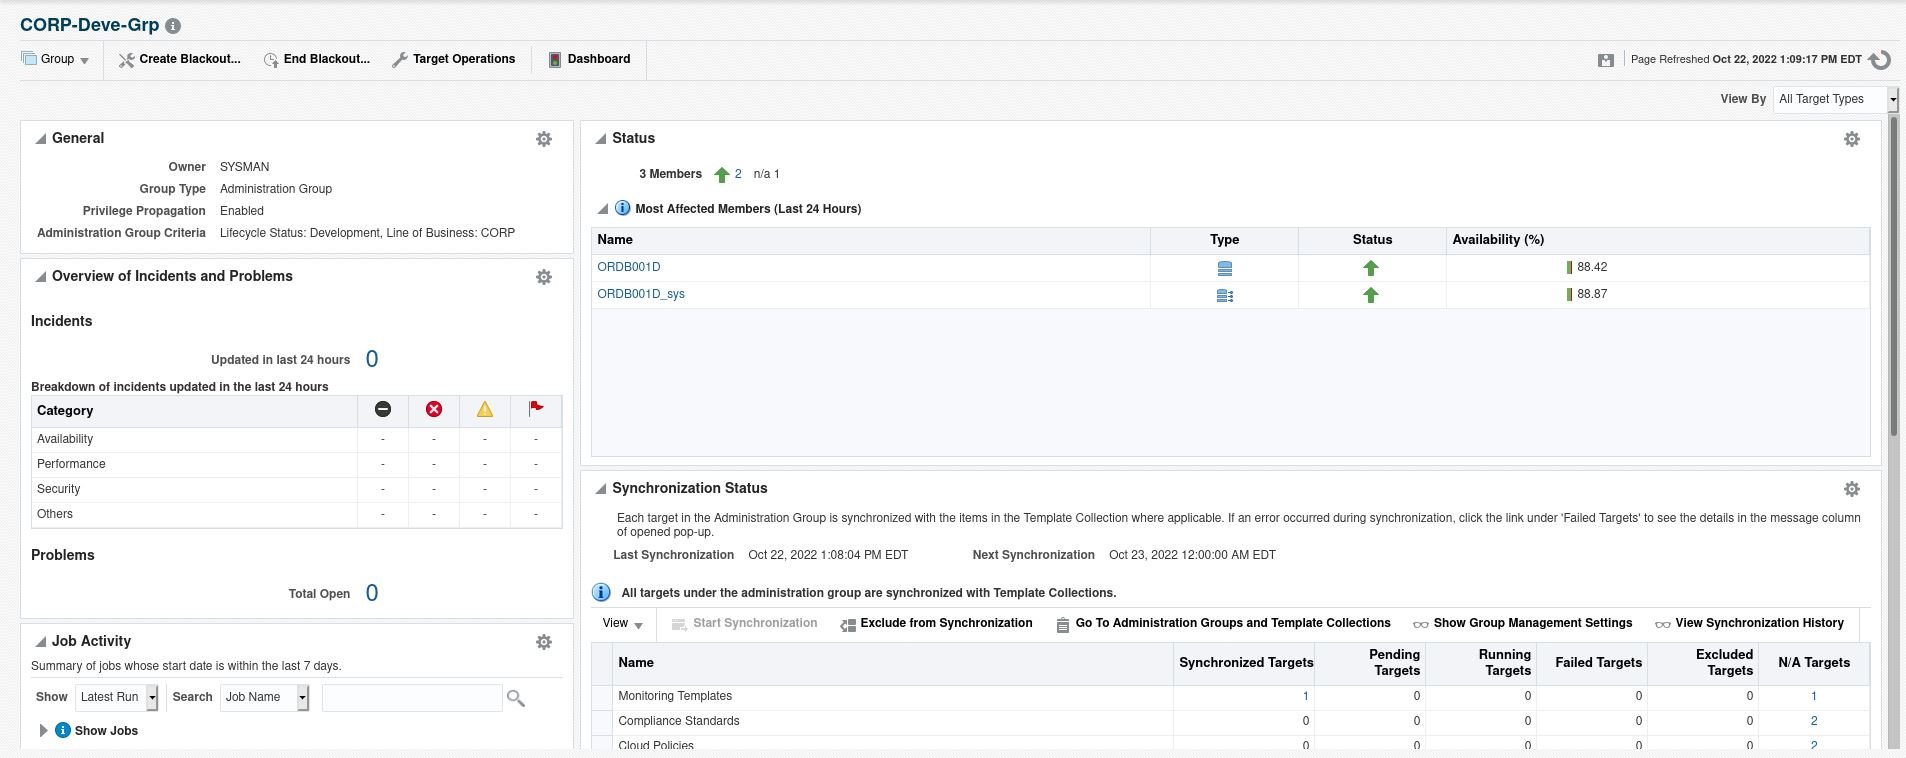
In this page you can see the members of the group as well as the “Synchronization Status” section.
Incident rules
I’ve already covered the basics of “Incident rules” in this post:
So now I’m going to explain some more advanced aspects of the incident rules.
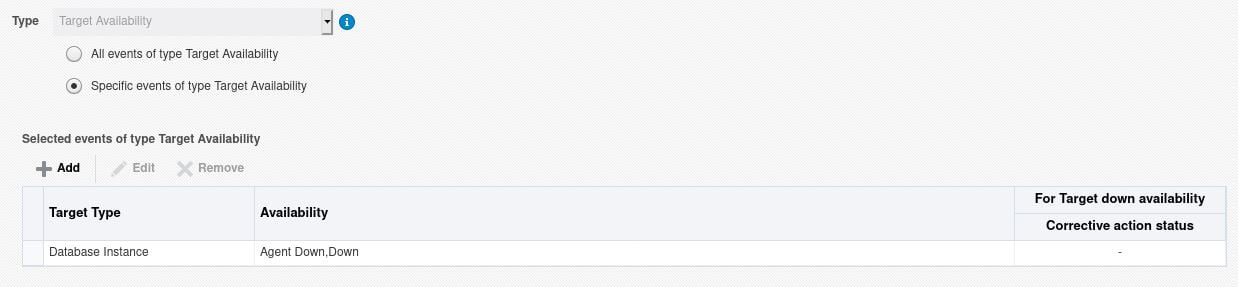
As mentioned previously when monitoring the status (UP/DOWN/MOUNT) of a database you have two different metrics you can use.
Both of these metrics belong to the “Response” group (for “Database Instance” target types). “Status” is a “Target Availability” event, so to monitor this metric you’ll have to create an incident rule as follows:
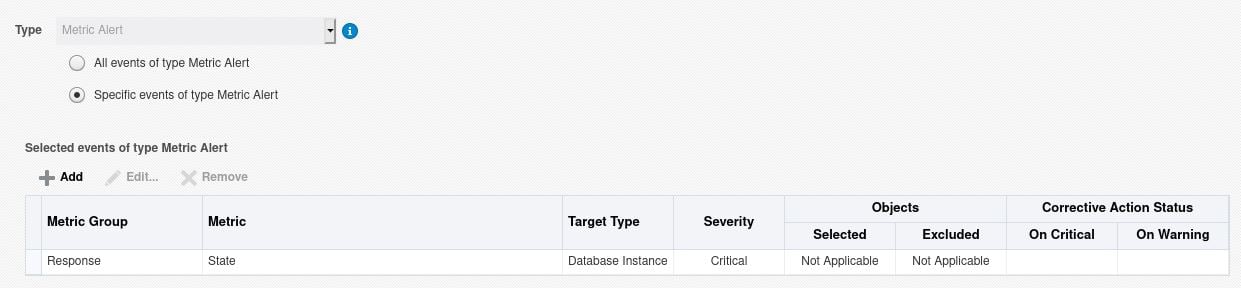
“State” is a simple “Metric alert” metric, to monitor the database status using this metric, you should create an incident rule as follows:
Another important aspect of the “Incident rules” are: The “Clear metric” option and the order of the rules.
Clear metric
The “Clear metric” checkbox: If selected, the metric alert will be cleared after being processed by the rule, which means that this event won’t be picked up by other rules in the processing queue.
In a situation where you’d like to have one rule to page the On-call DBA whenever there’s a Critical alert and another one to simply send an email to the DBA team for all alerts, you could place the paging rule on the top of the queue without selecting the “Clear metric” option, and place the send email rule lower in your queue and then select the “Clear Metric” option, that way the same metric would be picked up by both rules.
In the other hand if you only want pages, no emails, for Critical alerts, you can use the same setup, but selecting the “Clear metric” rule in the paging rule, that way Critical metrics would not be propagated to other rules and only a page would be sent for it.
Order of the rules
Order of the rule sets.The order of the rules in a rule set as well as the order of the rule sets themselves are very important. Ideally you should have the most important rules first, to make sure the events are properly escalated.And should you also make sure you check the “Clear Metric” checkbox is set if you don’t want the metric to be picked up by other rules, lower in the processing queue.
Always-On monitoring
The Enterprise Manager Always-On Monitoring is a sort of a backup monitoring system within OEM. Always-on monitoring provides the ability to monitor critical target status and metric alerts even when OEM is down.
You can configure it to send notifications at any time, especially when OEM is experiencing issues / downtime.
It relies on OEM’s configurations and notifications from the Enterprise manager agents to send notifications, only by email, to the administrators.
Always-On monitoring relies on it’s own repository database, which should not be stored on the same server as OEM’s repository DB.
Always-On monitoring requirements
Oracle lists the following as requirements for Always-On Monitoring (Source: Enterprise Manager Cloud Control Administrator’s Guide):
- A database running, at least, version Oracle 12.1.0.2.0 database with Bundle Patch 10, to hold the Always-On Monitoring repository. Do not placed this database on the same host as OEM or its repository database;
- A database user on the Always-On Monitoring repository database;
- Save the EM key to the Enterprise Manager repository;
- JAVA version 1.7;
- JDK7 must be installed in the environment where the user will run Always-On Monitoring (including emsca). The JAVA_HOME environment variable must point to the JDK7 location.
- Optimizer adaptive features should be disabled in the Always-On repository database:ALTER SYSTEM SET OPTIMIZER_ADAPTIVE_FEATURES=FALSE SCOPE=BOTH SID=’*’;
- The character set of the Always-ON repository DB must be the same as the OEM repository database:SELECT * from nls_database_parameters where parameter=’NLS_CHARACTERSET’;
Always-On monitoring installation
Create the EMS user in the Always-On monitoring repository database:
create user ems identified by ems;

grant CREATE SESSION,
ALTER SESSION,
CREATE DATABASE LINK,
CREATE MATERIALIZED VIEW,
CREATE PROCEDURE,
CREATE PUBLIC SYNONYM,
CREATE ROLE,
CREATE SEQUENCE,
CREATE SYNONYM,
CREATE TABLE,
CREATE TRIGGER,
CREATE TYPE,
CREATE VIEW,
UNLIMITED TABLESPACE,
SELECT ANY DICTIONARY to ems;
grant EXECUTE ON SYS.DBMS_CRYPTO to ems;
grant EXECUTE ON SYS.DBMS_AQADM to ems;
grant EXECUTE ON SYS.DBMS_AQ to ems;
grant EXECUTE ON SYS.DBMS_AQIN to ems;
grant EXECUTE on SYS.DBMS_LOCK to ems;
grant EXECUTE ON SYS.DBMS_SCHEDULER to ems;
grant create job to ems;
Always-On Monitoring is a self-contained application supplied with OEM’s software distribution (located in the sysman/ems directory). It’s also available via the Self-Update function in Enterprise Manager.
Unzip the Always-On Monitoring installation zip file in the destination folder:
$ unzip -q ems_13.1.0.0.0.zip -d /u01/oracle/alwayson/
Configure Always-On monitoring using a response file
Create the response file as follows:
emsRepConnectString=localhost:1521:OEMAOM
emsRepUsername=ems
emsRepPassword=ems
emRepConnectString=oem13cdb.example.com:1521:oem13c
emRepUsername=sysman
emRepPassword=sysman
emsPort=7803
http.protocol=http
And config Always-On monitoring, without creating the EMS user, since we have already done t.
$ cd /u01/oracle/alwayson/
$ ./emsca -createEmsDbUser=false -
Always-On relies on OEM’s notification settings to send emails. It’s important to re-synchronize Always-On every time there’s any change in the mail servers configured in OEM.
Enterprise Manager downtime contacts
Note: To keep Always-On downtime contacts updated, you should re-synchronize it afer changing these details on OEM.
$ ./emcli set_oms_property -property_name='oracle.sysman.core.events.ems.downtimeContact' -property_value='<email addresses>'
To set Downtime contacts at the target level, use the following:
$ ./emcli set_target_property_value -property_records="myhost:host:Downtime Contact:user@example.com"
Synchronize Always-On with OEM
$ /u01/oracle/alwayson/scripts/emsctl sync
Oracle Database Consulting Services
Ready to optimize your Oracle Database for the future?