There are many different methods to monitor Apache Cassandra metrics. From a high level, these methods can be grouped in two general types of techniques: push versus poll. The meaning of the two types is actually quite simple. If a technique used is helping Cassandra service to push out its internal metrics to a target receiver/sink, this technique belongs to "push" type. Otherwise, if a technique is used to query Cassandra service on demand in order to get the required metrics, this technique belongs to "poll" type. The
Pluggable Metrics Reporting feature as introduced in Cassandra 2.0.2 is a push type technique, which I have described with much more detail in another post that can be found
here. In this post, I will explore two simple but useful methods to poll Cassandra metrics through a JMX Http Bridge. One method is to pull Cassandra metrics through MX4J Http Adaptor and another method is through Jolokia JVM agent. At very high level, both methods contains a lightweight HTTP server in order to translate HTTP based Cassandra metrics requests to JMX requests. The difference is that MX4J works as a regular standard web page operation, but Jolokia works as a REST API. Please note that both MX4J and Jolokia are general JMX related techniques, the detailed description of them is beyond the scope of this post. If you're interested, please refer to their web pages respectively:
MX4J,
Jolokia. In this post, I will focus on how to configure Apache Cassandra in order to enable the features of polling metrics through MX4J and Jolokia.
Configure MX4J HTTP Adaptor in Cassandra
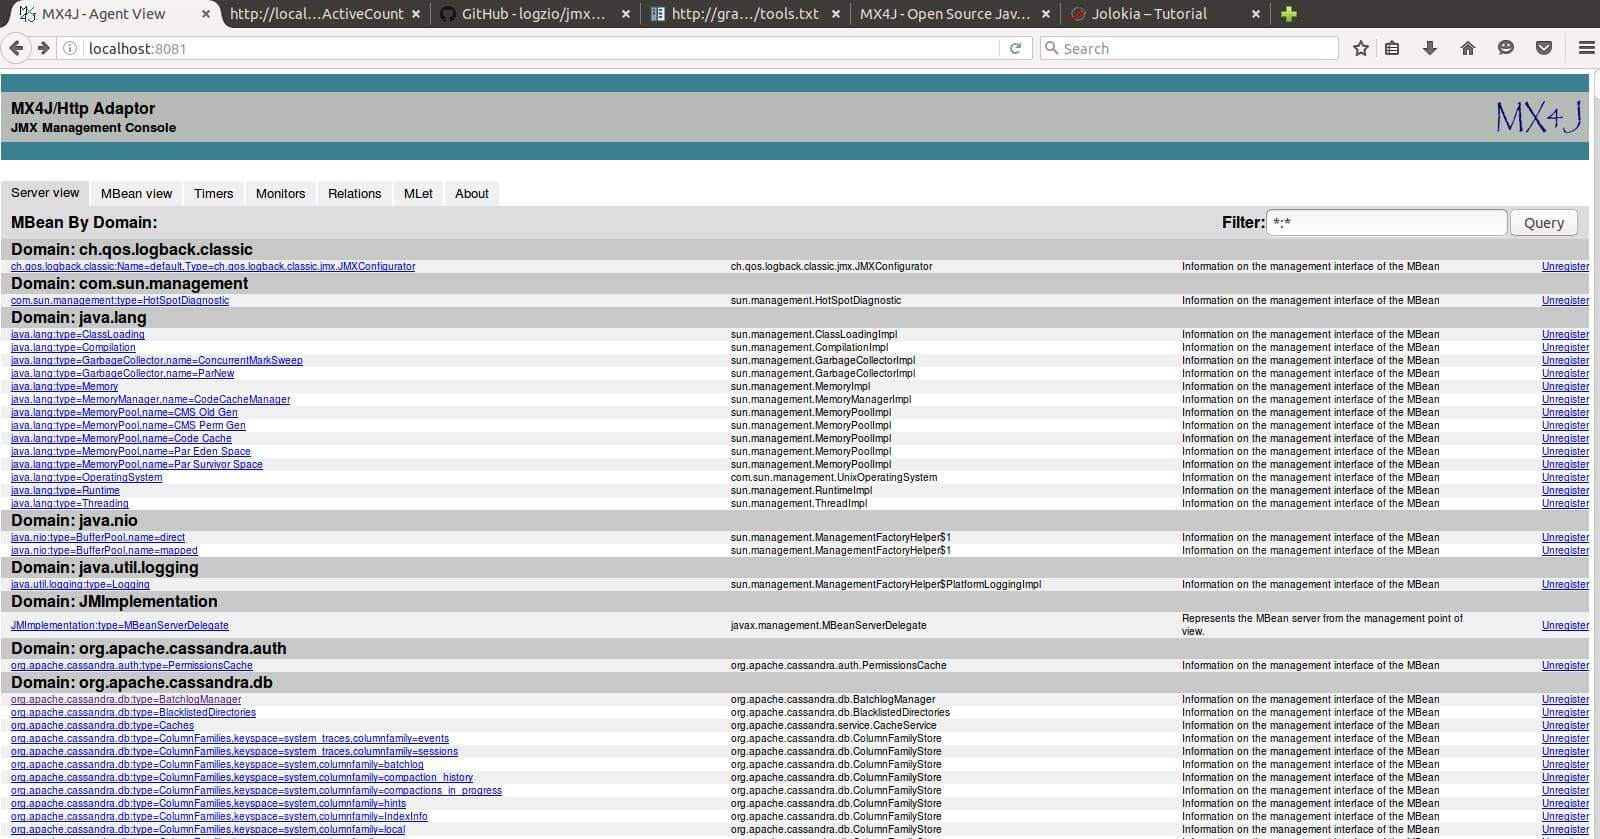
The steps to configure MX4J HTTP Adaptor in Cassandra are as below: 1). Download latest MX4J binary (e.g. mx4j-3.0.2.tar.gz) from here. 2) .Extract the binary and copy mx4j-tools.jar file (<MX4J extract home folder>/lib/mx4j-tools.jar) to Cassandra's lib folder (e.g. /usr/share/cassandra/lib) 3). In cassandra-env.sh file, enable/add the following lines: [code language="bash"] MX4J_ADDRESS="-Dmx4jaddress=<Cassandra Node IP>" # e.g. localhost or 127.0.0.1 MX4J_PORT="-Dmx4jport=<MX4J port>" # default port: 8081 JVM_OPTS="$JVM_OPTS $MX4J_ADDRESS" JVM_OPTS="$JVM_OPTS $MX4J_PORT" [/code] 4). Restart Cassandra service. When successful, you should see the following message in Cassandra system log. [code] INFO [main] 2016-06-20 10:18:11,493 Mx4jTool.java:63 - mx4j successfully loaded [/code] 5). Open a browser and now you're ready to browse all Cassandra metrics. An example screenshot is as below:
Configure Jolokia JVM Agent in Cassandra
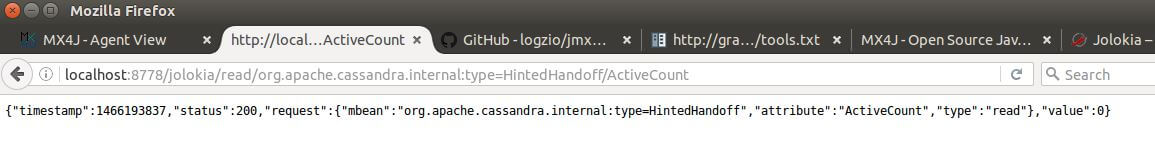
The steps to configure Jolokia JVM Agent in Cassandra are as below: 1). Download the latest Jolokia JVM agent jar file (e.g. jolokia-jvm-1.3.3-agent.jar) from here. 2). Copy the downloaded jar file to Cassandra's lib folder (e.g. /usr/share/cassandra/lib) 3). In cassandra-env.sh file, enable/add the following lines: [code] # Jolokia javaagent JVM_OPTS="$JVM_OPTS -javaagent:$CASSANDRA_HOME/lib/jolokia-jvm-1.3.3-agent.jar" [/code] Note that the agent by default listens on port 8778. But it can be changed via the following ways: [code] JVM_OPTS="$JVM_OPTS -javaagent:$CASSANDRA_HOME/lib/jolokia-jvm-1.3.3-agent.jar=port=<agent_port>,host=<node_ip>", or JVM_OPTS="$JVM_OPTS -javaagent:$CASSANDRA_HOME/lib/jolokia-jvm-1.3.3-agent.jar=config=/path/to/config.properties [/code] A complete Jolokia JVM agent configuration options can be found at here. 4). Restart Cassandra service. Please note that Jolokia agent provides Java REST API endpoints, so it can be used with any tool and/or program that work with Java REST API. Below is an example of using the REST API (through a web browser) to access the Cassandra metrics of "active HintedHandoff count":
Conclusion
In this post, I explored two ways of polling Cassandra metrics through a JMX HTTP bridge. MX4J HTTP Adaptor provides a convenient way to easily browser all available Cassandra metrics under different categories. Jolokia JVM agent, on the other hand, provides a simple yet powerful way to interact with Cassandra metrics programmatically. Both techniques, especially Jolokia JVM agent, can be used as the metrics feeder component of a more complete Cassandra metrics monitoring solution. For example, jmx2graphite provides the capability to read Cassandra metrics as exposed by Jolokia agent every X seconds and writes them to a Graphite server.On this page
Share this
Share this
Step-by-bstep monitoring Cassandra with with Prometheus and Grafana
![]()
Step-by-bstep monitoring Cassandra with with Prometheus and Grafana
Dec 3, 2018 12:00:00 AM
4
min read
Monitoring Cassandra with Grafana and Influx DB
![]()
Monitoring Cassandra with Grafana and Influx DB
Mar 16, 2015 12:00:00 AM
4
min read
Useful CQLSH Commands for Everyday Use

Useful CQLSH Commands for Everyday Use
Jul 5, 2022 12:00:00 AM
8
min read