How to analyze SQL server stack dumps
Troubleshooting SQL server stack dumps: A practical guide
As a SQL Server production DBA, at some point in time you will have to deal with a stack dump. A stack dump is a file that is written to disk with an ".mdmp" extension when SQL Server encounters a running condition that it does not have a built-in error to handle. It contains the call stacks and memory information of the threads running when this situation happened and it's done so that it can be used for troubleshooting after the fact. The reason for this type of error condition to happen varies quite a bit , and it can range from CPU scheduling problems, issues with RAM chips, very heavy IO latency, linked server drivers, etc. In the worst case, the stack dumps can cause serious system instability and can trigger cluster failovers or SQL Server service restarts. In this blog post, we're going to focus on analyzing the somewhat common condition of the Non-Yielding scheduler. Because Microsoft owns the SQL Server source code, they are best positioned to be able to troubleshoot these unhandled conditions. However, this doesn't mean that we can't do some analysis ourselves and in many cases get a solid idea of what is triggering the issue. As such, knowing how to do this analysis can be critical to getting quick workarounds in place while you are working with Microsoft support to find a root cause and permanent fix. Now, let's move to the actual practical piece and get started!
Getting started: tools and environment setup
- The first thing you're going to want to do is to have a stack dump to analyze. If you have already experienced this on your system, then you can go find the .mdmp files in the Log directory where the SQL ERRORLOG is found.
- Head over to this link and download and install the debugging tools for Windows. The one we are interested in is called WinDbg. There are several methods to get the tools on your system, I personally downloaded the Windows SDK ISO and then during installation only selected "Debugging tools for Windows".
- Open WinDbg (in my case it was located in C:\Program Files\Windows Kits\10\Debuggers\x64), go to File – Open Crash Dump.
-
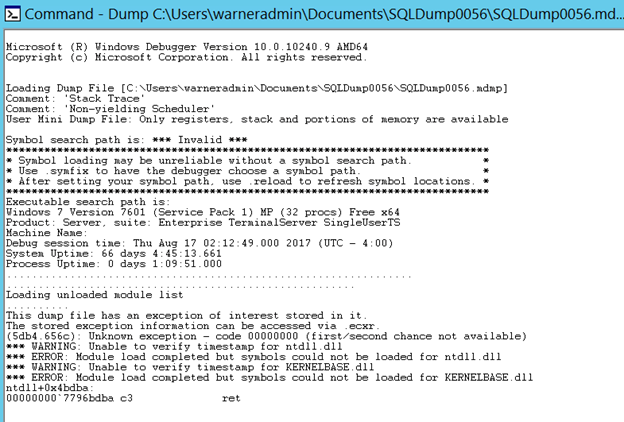
The tool has now recognized that this file is a stack dump and there is information that could be valuable.

- We can verify that the dump was generated by a 'Non-yielding Scheduler' condition and WinDbg has found "an exception of interest stored in it".
-
At this point, we can't see much detail because we don't have the public symbols for SQL Server on the analysis machine. Public symbols are files provided by the software developer (in this case Microsoft) that give high-level information on the executable to be able to do this type of debugging. For example, in the case of SQL Server, we want to be able to see the method names inside the C++ code. There are also private symbols which provide even more information like local variable names or source line info, but these are only accessible to the developer of the application, in this case Microsoft support.
-
To get the symbols we will download off of Microsoft's server, go to the command line on WinDbg and type the following:.sympath srv*c:\debugsymbols*https://msdl.microsoft.com/download/symbols; This command will set the Symbols path for the tool on c:\debugsymbols and will point it to download them from Microsoft's public symbol URL. To load the symbols now type: .reload /f The tool will start downloading the files and might throw some errors if it can't find symbols for some of the DLLs. That's OK as long as it was able to find the symbols for SQL Server. At this point, it's a good idea to save this configuration in a workspace so that we don't have to enter it every time. To do this, just go to File – Save Workspace and give it a name. Next time, you can open WinDbg, open the Workspace and then the crash dump and you won't need to reload the symbols. Back to the command screen, we can verify that the symbols for SQL Server are available by running: lmvm sqlservr

- We can see in the output that indeed there is a match found in our symbols for the module mentioned in the dump, in this case, the main SQL Server executable sqlservr.exe. It also provides the exact version information for SQL Server. For example, the above screenshot identifies version 11.0.6594 which is SQL Server 2012 Service Pack 3, cumulative update #4. Of course, you can always get the information from the server itself, but if all you have is the file available, then this is an alternative way to get it. Knowing the exact version information is important since the dump could have been generated by a bug that is specific to a version.
-
OK, so now we're all setup but where do we start to analyze the dump content? Keep in mind that the dump has information from all the threads active when the dump happened . However, we're only interested in the thread that actually caused the issue. The easiest way to get started is to let WinDbg analyze the dump, see if it finds an exception and take you to that context.To do this, type the following command: !analyze –v This command will display where the exception is found and the call stack with it. In this particular case I got: ntdll!NtWriteFile+0xa KERNELBASE!WriteFile+0xfe kernel32!WriteFileImplementation+0x36 sqlmin!DiskWriteAsync+0xd9 sqlmin!FCB::AsyncWrite+0x19a sqlmin!RecoveryUnit::GatherWrite+0xc2 sqlmin!BPool::LazyWriter+0x549 sqlmin!lazywriter+0x204 sqldk!SOS_Task::Param::Execute+0x21e sqldk!SOS_Scheduler::RunTask+0xa8 sqldk!SOS_Scheduler::ProcessTasks+0x29a sqldk!SchedulerManager::WorkerEntryPoint+0x261 sqldk!SystemThread::RunWorker+0x8f sqldk!SystemThreadDispatcher::ProcessWorker+0x372 sqldk!SchedulerManager::ThreadEntryPoint+0x236 kernel32!BaseThreadInitThunk+0xd ntdll!RtlUserThreadStart+0x1d
- There is a caveat around Non-yielding scheduler dumps. Sometimes, the stack that you get through analyze might not be the one that was not yielding. The reason for this is because, by the time the dump is generated, the task might have actually yielded. To cover for this scenario, SQL Server copies the offending stack to a global address that we can reach on the dump. This is the command to move to that structure: .cxr sqlmin!g_copiedStackInfo+0X20 That .cxr command is used to set the debugger context to a particular address which we know beforehand in this case. You might be thinking, where I came up with that special copiedStackInfo context. The truth is that this is just knowledge that is floating around the Internet, which is based on information published by Microsoft's own support team. For example, you can see one blog post here. Once I'm in that context, I get the call stack with this command: Kc 100 The K command displays the call stack of the current context, the letter c means we want the output to be 'clean' and only show module and function names. Finally, the 100 means we want to see up to 100 calls down the stack. For this particular dump both stacks were the same, however, in other scenarios it could have been different.
-
With the call stack available, let's see how to read it. First, remember it's a stack so the method called last is actually the one at the top. In order to follow the logical sequence of events then we need to read from the bottom-up.In this particular call stack, we can see the following sequence of events:
- Thread got a task assigned
- The task was to do a lazy writer memory sweep
- Lazy writer uses a Gather Write method to group many pages into one write IO
- Then initiates an asynchronous IO request
-
Then the thread moves into kernel mode to do the file write operation
- Analyze the buffer cache and see which database is consuming most memory
- Look into processes changing a lot of data at once and break them up
-
Look into storage latency and see if we're not getting what we should in terms of latency and throughput
Let's look at another case, this time it was a 'Latch timeout' situation. Let's see the steps:
-
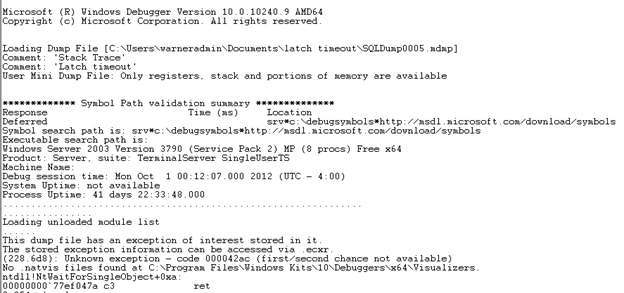
I open the workspace I created in the previous example and then open the dump. Here's the output:

- We can see at the top the dump type as 'Latch timeout' and again we can see there is 'an exception of interest stored in it'.
-
We can verify we got the symbols again and here's what we get:

- We can tell that based on version, this is SQL Server 2005 SP4.
-
We run !analyze –v and this is the call stack generated:kernel32!RaiseException sqlservr!CDmpDump::Dump sqlservr!CImageHelper::DoMiniDump sqlservr!stackTrace sqlservr!LatchBase::DumpOnTimeoutIfNeeded sqlservr!LatchBase::PrintWarning sqlservr!_chkstk sqlservr!LatchBase::AcquireInternal sqlservr!KeyRangeGenerator::GetNextRange sqlservr!IndexDataSetSession::GetNextRangeForChildScan sqlservr!IndexDataSetSession::SetupNextChildSubScan sqlservr!IndexDataSetSession::GetNextRowValuesInternal sqlservr!RowsetNewSS::FetchNextRow sqlservr!CQScanTableScanNew::GetRow sqlservr!CQScanNLJoinTrivialNew::GetRow sqlservr!CQScanNLJoinNew::GetRowHelper sqlservr!CQScanNLJoinNew::GetRowHelper sqlservr!CQScanSortNew::BuildSortTable sqlservr!CQScanSortNew::OpenHelper sqlservr!CQScanNLJoinNew::Open sqlservr!CQScanNew::OpenHelper sqlservr!CQScanXProducerNew::Open sqlservr!FnProducerOpen sqlservr!FnProducerThread sqlservr!SubprocEntrypoint sqlservr!SOS_Task::Param::Execute sqlservr!SOS_Scheduler::RunTask sqlservr!SOS_Scheduler::ProcessTasks sqlservr!SchedulerManager::WorkerEntryPoint sqlservr!SystemThread::RunWorker sqlservr!SystemThreadDispatcher::ProcessWorker sqlservr!SchedulerManager::ThreadEntryPoint
-
The call stack is giving this sequence of steps:
- Thread got a task assigned
- A parallel operation is requesting a table scan
- The thread is requesting a range of keys to work on
- A latch is requested to get the range and it times out
Going back to the SQL Server Errorlog around the time of the dump, we have messages like this one: Timeout occurred while waiting for latch: class 'ACCESS_METHODS_SCAN_RANGE_GENERATOR', id 00000002042630D0, type 4, Task 0x00000000055F8B08 : 7, waittime 300, flags 0x1a, owning task 0x00000000049B7C18. Continuing to wait. We know that the ACCESS_METHODS_SCAN_RANGE_GENERATOR is a latch type used to distribute work during parallel scans, so both the log and the dump are confirming the issue. -
An alternative way to navigate the dump is to search the dump for a particular string. For this we can use the X command:X *!*DoMiniDump* I'm using the * character as a wildcard to tell WinDbg to go look inside any module (*!) and find a function that contains this string (*DoMiniDump*). Sure enough, I get this result: 00000000`01f6c0d0 sqlservr!CImageHelper::DoMiniDump So now we know the exact function name we want, we can search for it with this command: !findstack sqlservr!CImageHelper::DoMiniDump And we get this result: Thread 054, 1 frame(s) match * 15 000000000fc5aba0 0000000001f6f797 sqlservr!CImageHelper::DoMiniDump+0x413 From that result, we know that the thread that produced the dump was #54. So we move to that thread with this command: ~54s The ~ symbol is a command to do a thread related action, the 54 is the thread number we want and the letter s is telling the debugger to make this the current thread. Finally, same as the previous example, we can run kc 100 and we would get the call stack that I mentioned on step #3 above.
-
Given what we have found, this case definitely looks like a parallelism related bug but at least we know it is triggered by a parallel scan operation. While we get a fix from support, we could apply workarounds to avoid the parallel scan through indexing, query tuning or running the query with no parallelism for now.
Conclusion and workarounds
So we've seen an example for 'Non-yielding Scheduler' and 'Latch timeout', but you can apply a similar process to analyze other dump types like 'Deadlock scheduler', 'Unhandled exception' and 'Access violation'. Again, the goal is to be able to figure out quick workarounds that help you honor the SLA of your database and its applications even while dealing with product errors. In parallel, work with support to find a true resolution or you patch the server up if it's something that already has a fix.
SQL Server Database Consulting Services
Ready to future-proof your SQL Server investment?
Share this
Share this
More resources
Learn more about Pythian by reading the following blogs and articles.
Top 10 New Features of SQL Server 2019

Driving Enterprise Innovation: Warner Chaves on Oracle-Google Cloud Collaboration

SAP on MSSQL: An 8-Step Homogeneous System Copy Approach
Ready to unlock value from your data?
With Pythian, you can accomplish your data transformation goals and more.
