Having good historial metrics monitoring in place is critical for properly operating, maintaining and troubleshooting database systems, and
Percona Monitoring and Management is one of the options we recommend to our clients for this. One common concern among potential users is how using this may impact their database's performance. As I could not find any conclusive information about this, I set out to do some basic tests and this post shows my results. To begin, let me describe my setup. I used the following Google Cloud instances:
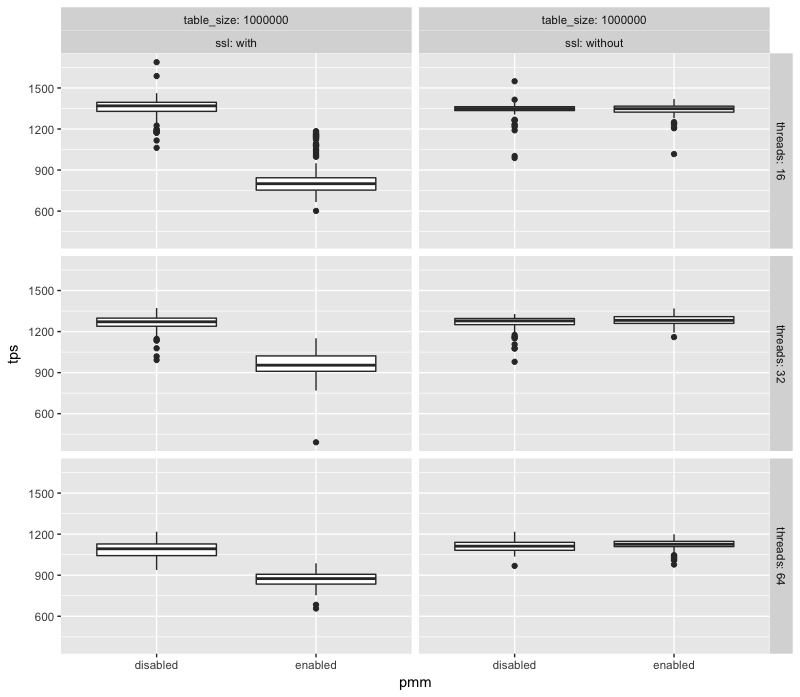 We can see that with SSL enabled there is a noticeable drop in throughput when the exporters are running, while this is not the case when SSL is disabled. I arrived at the conclusion that it was worth repeating the tests with SSL disabled after creating
Flame Graphs from perf captures during sample runs. On them, the only significant increases were due to the exporters (mysqld_exporter and node_exporter, the qan exporter did not have any noticeable impact during my tests). The results from the tests show that this analysis pointed me in the right direction so while they are worth of separate blog posts, it is worth to at least recommend our readers to get familiar with this performance analysis tool. Next is a scatter plot of throughput over time with ssl enabled:
We can see that with SSL enabled there is a noticeable drop in throughput when the exporters are running, while this is not the case when SSL is disabled. I arrived at the conclusion that it was worth repeating the tests with SSL disabled after creating
Flame Graphs from perf captures during sample runs. On them, the only significant increases were due to the exporters (mysqld_exporter and node_exporter, the qan exporter did not have any noticeable impact during my tests). The results from the tests show that this analysis pointed me in the right direction so while they are worth of separate blog posts, it is worth to at least recommend our readers to get familiar with this performance analysis tool. Next is a scatter plot of throughput over time with ssl enabled:
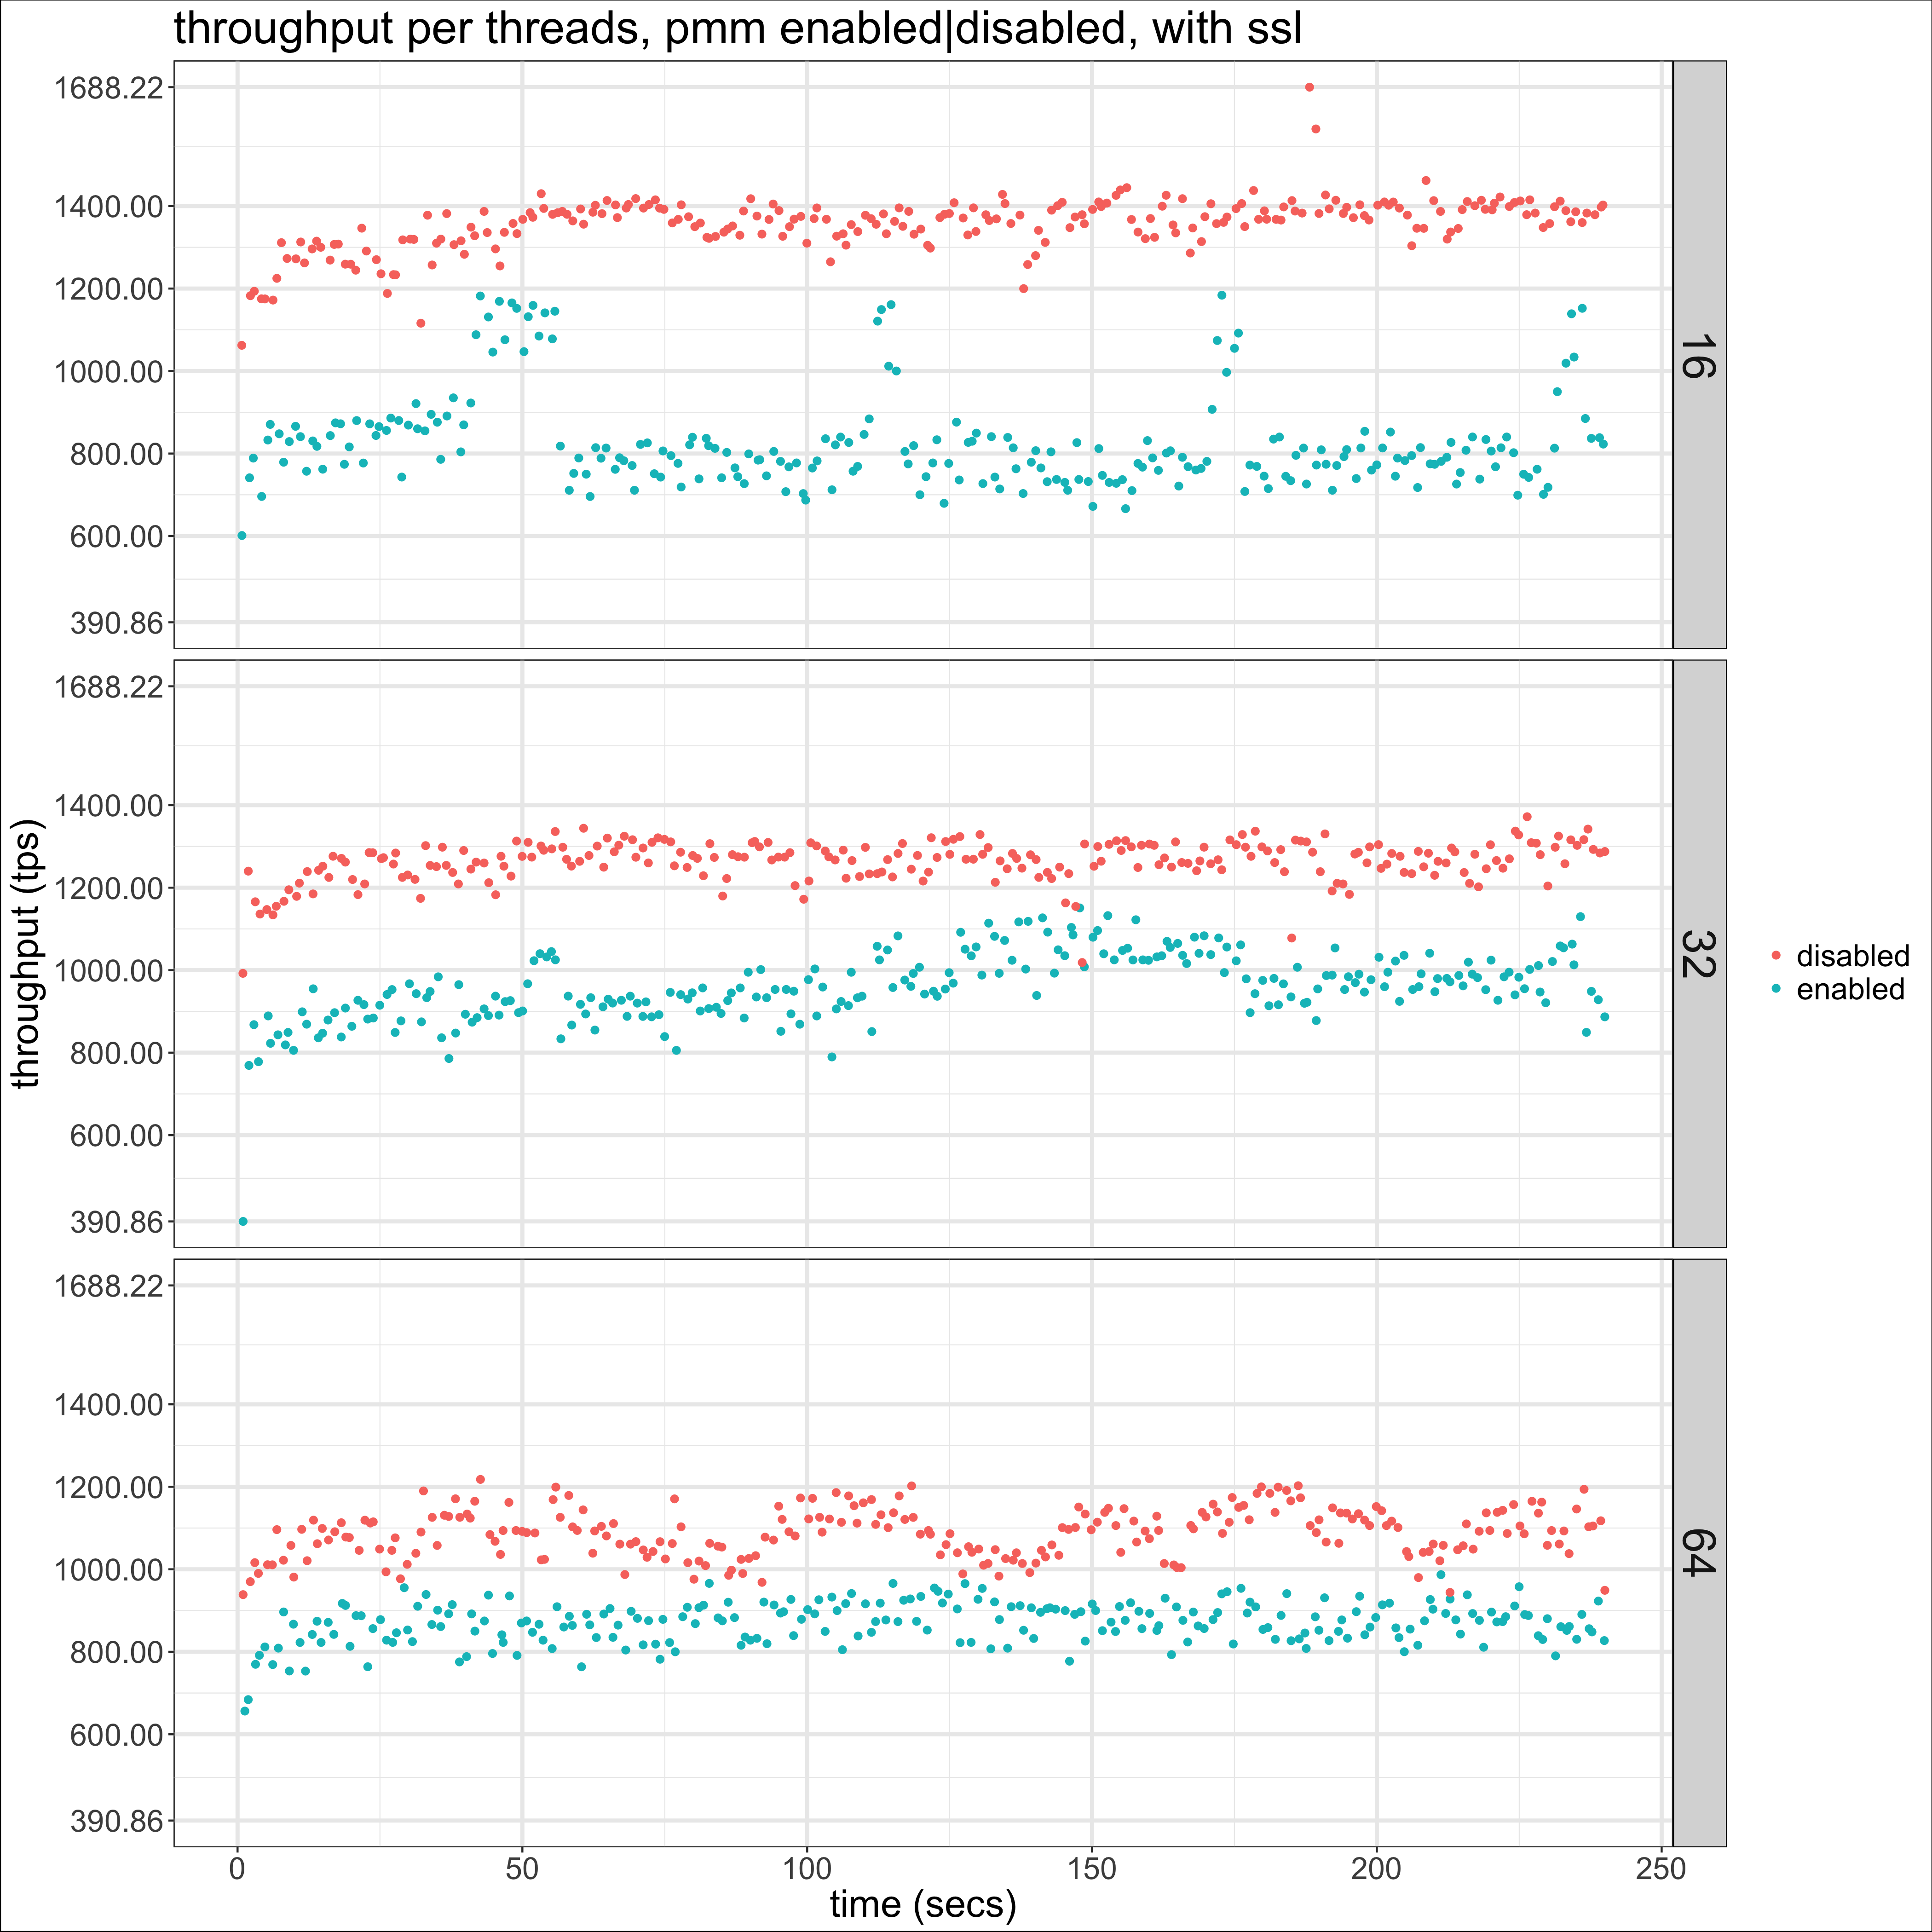 On it we get a more clear picture of the impact of having the exporters running during the test. Next is the same graphs but with SSL disabled:
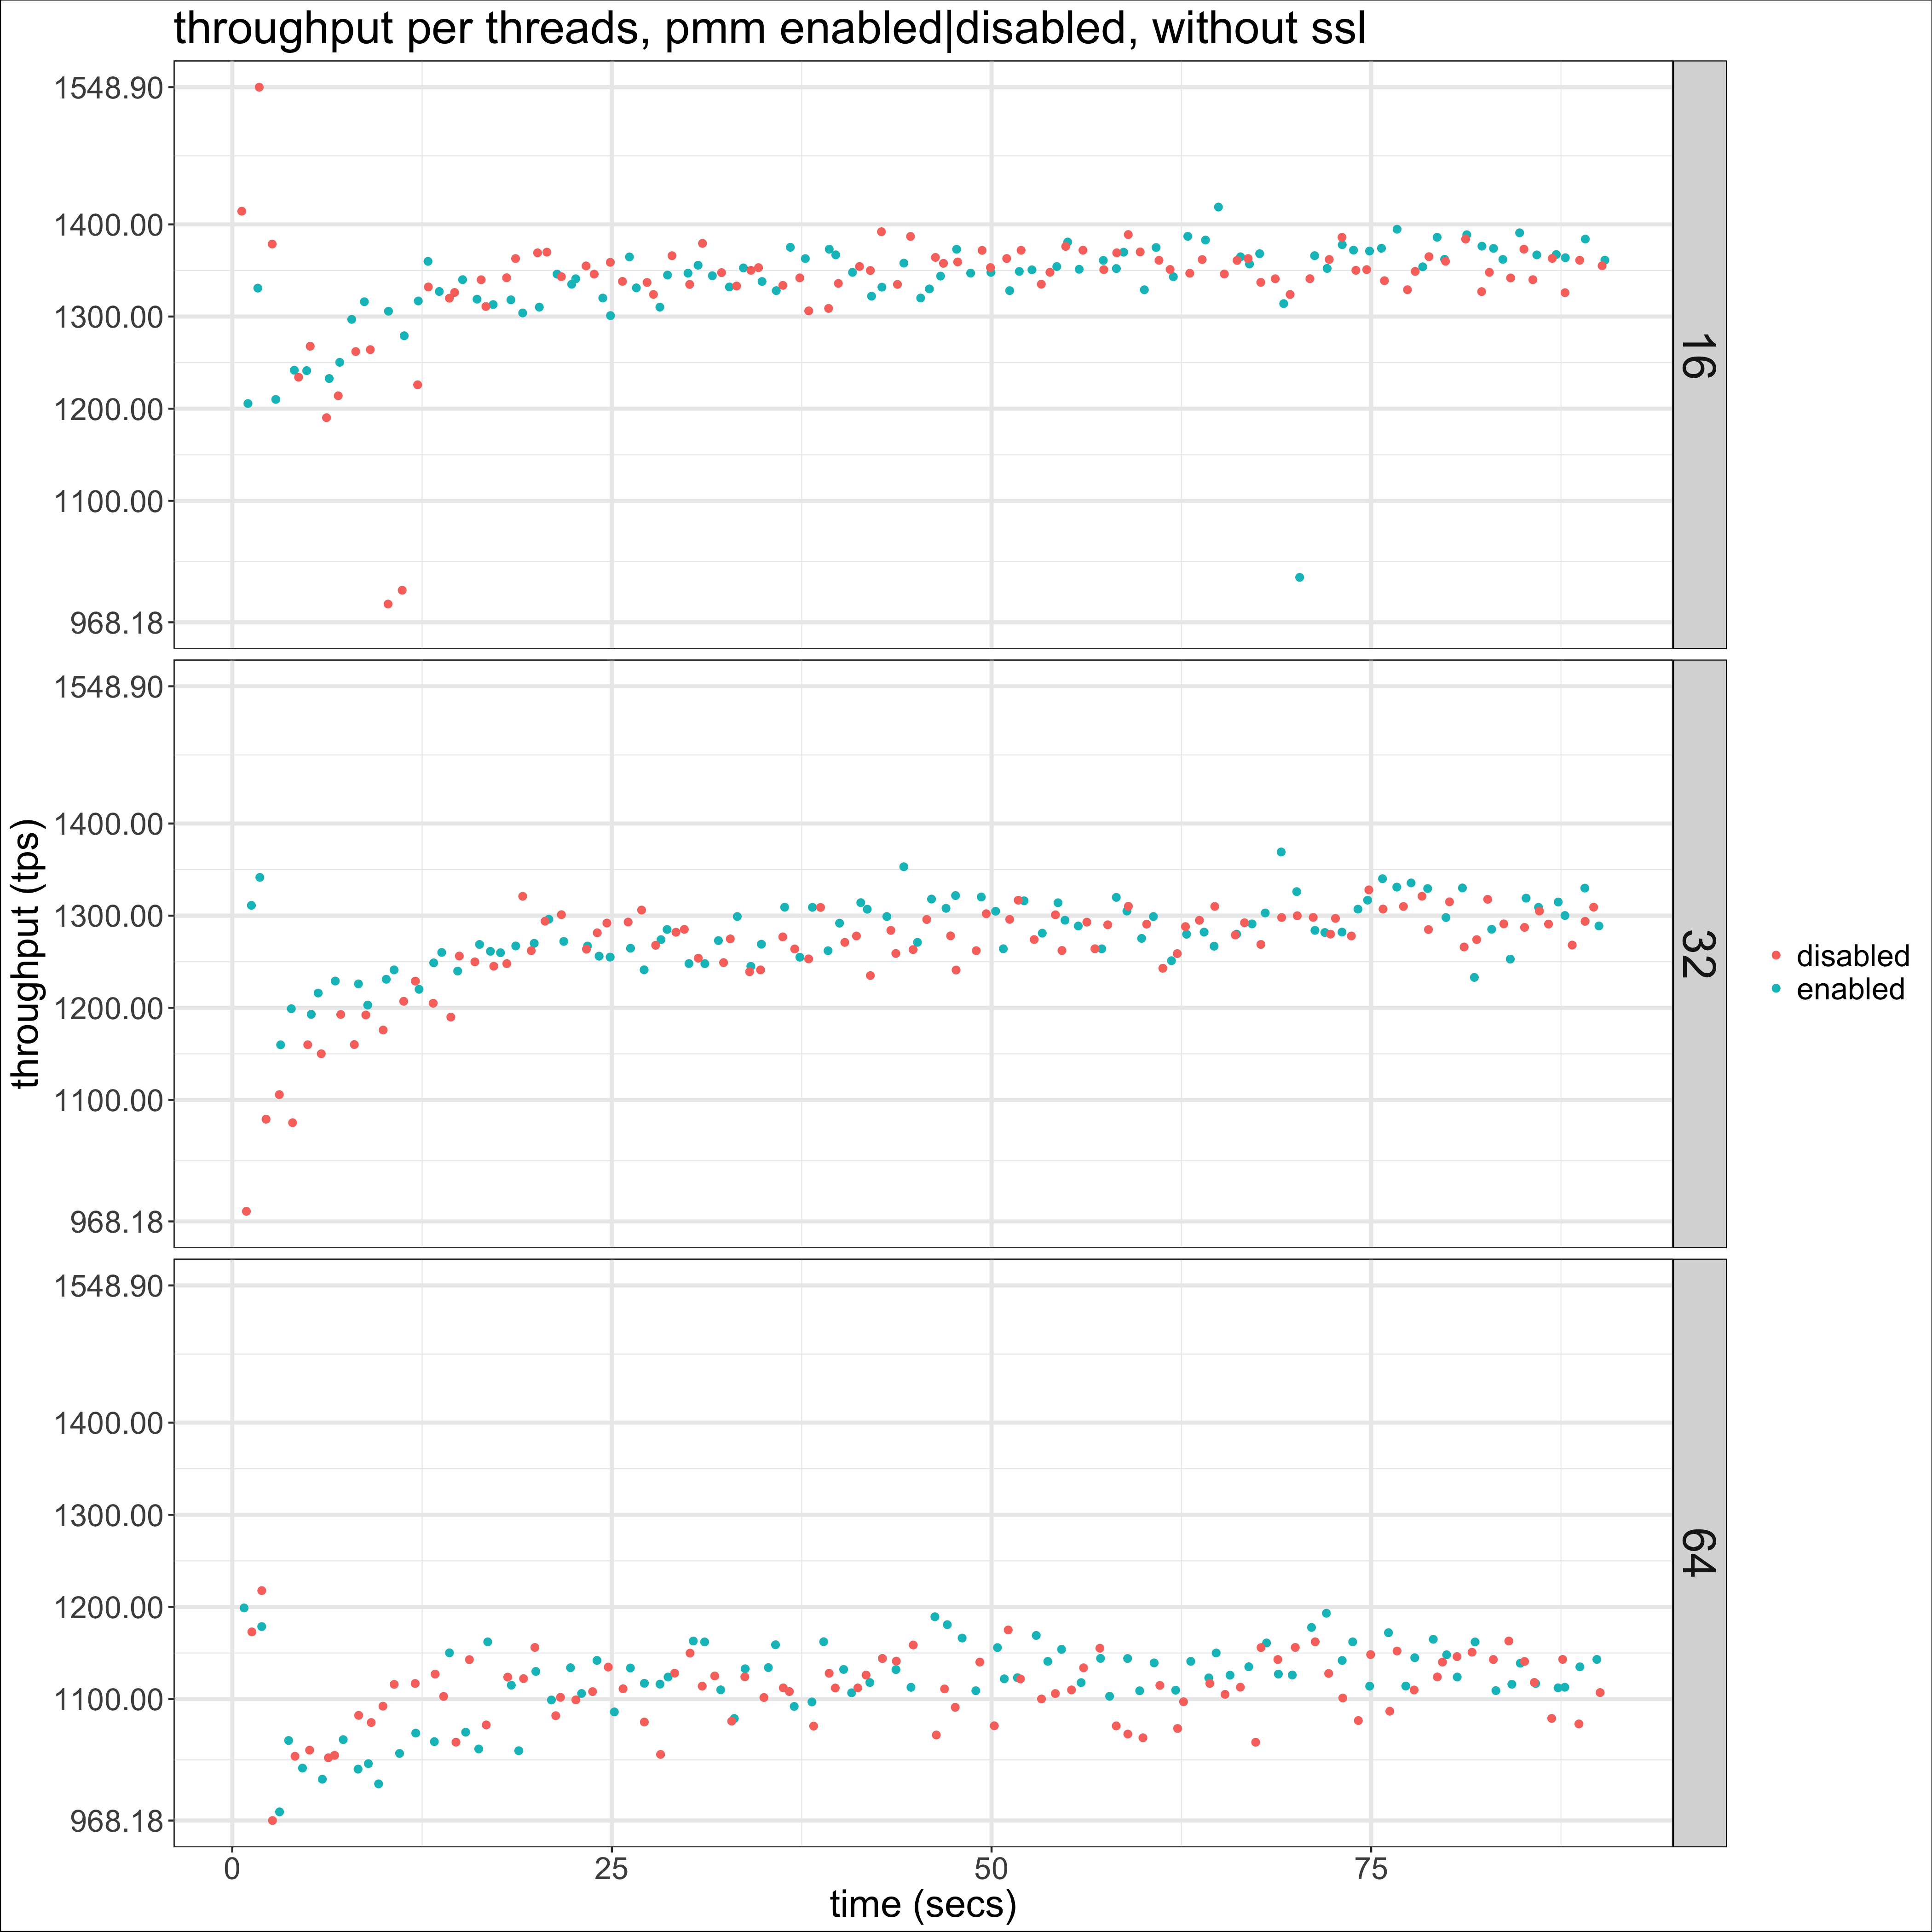 Now it is much more difficult to differentiate the runs. This is confirmed if we look at the 99 percentile of throughput for each case (here for 32 threads):
- One 4 vCPU instance for the MySQL server
- One 2 vCPU instance for the sysbench client
- One 1 vCPU instance for the PMM server
We can see that with SSL enabled there is a noticeable drop in throughput when the exporters are running, while this is not the case when SSL is disabled. I arrived at the conclusion that it was worth repeating the tests with SSL disabled after creating
Flame Graphs from perf captures during sample runs. On them, the only significant increases were due to the exporters (mysqld_exporter and node_exporter, the qan exporter did not have any noticeable impact during my tests). The results from the tests show that this analysis pointed me in the right direction so while they are worth of separate blog posts, it is worth to at least recommend our readers to get familiar with this performance analysis tool. Next is a scatter plot of throughput over time with ssl enabled:
On it we get a more clear picture of the impact of having the exporters running during the test. Next is the same graphs but with SSL disabled:
Now it is much more difficult to differentiate the runs. This is confirmed if we look at the 99 percentile of throughput for each case (here for 32 threads):
| PMM | SSL | tps (p99) |
| enabled | enabled | 1167.518 |
| enabled | disabled | 1397.397 |
| disabled | disabled | 1429.097 |
Conclusion
PMM is a very good Open Source option for monitoring but as every instrumentation and monitoring layer you add to your stack, it won't come for free. My very simple tests show that its impact may be significant under some scenarios, yet if it's bad enough it may be mitigated by using HTTP instead of HTTPS for the exporters. Given the events that are unfolding in IT security as I type this, it may seem reckless to recommend disabling SSL as an "optimization", but I think good engineering is all about informed tradeoffs and if you're running this on a secure private network, how risky is it to expose monitoring metrics over HTTP instead of HTTPS? I would love to read answers to this question in the comments! Finally, I think a similar cost is probably paid for the TLS layer on the pmm-server end. It would be very interesting to see an experiment like this repeated but on a different scenario: one pmm-server with several monitored clients.On this page
Share this
Share this
How to Run DBSAT 2.2.0 on Oracle Cloud PDB using Wallet

How to Run DBSAT 2.2.0 on Oracle Cloud PDB using Wallet
Feb 13, 2020 12:00:00 AM
10
min read
What you should know about Docker Containers for Oracle Data Integrator
![]()
What you should know about Docker Containers for Oracle Data Integrator
Aug 1, 2017 12:00:00 AM
12
min read
MSDB – Cleanup is necessary

MSDB – Cleanup is necessary
Oct 22, 2013 12:00:00 AM
2
min read