A client was moving an Oracle 11.2.0.4 database from their data center to one of the major cloud providers' infrastructure. Even though the database was version 11.2.0.4, the findings and conclusions are also relevant for newer versions. This was seamlessly achieved by a switchover to the new primary located in the cloud. After the migration, the wait times for "log file sync" waits increased, and there were occasional spikes where wait times for this wait event exceeded 1 second per wait. This post is meant to illustrate how I proceeded with the investigation, which unraveled a chain of events causing this problem, and how the issue was permanently fixed by finding and addressing the root cause. In order not to make the post too long, some details that are not directly relevant to the topic I want to illustrate will be omitted.

Data Guard setup before the switchover
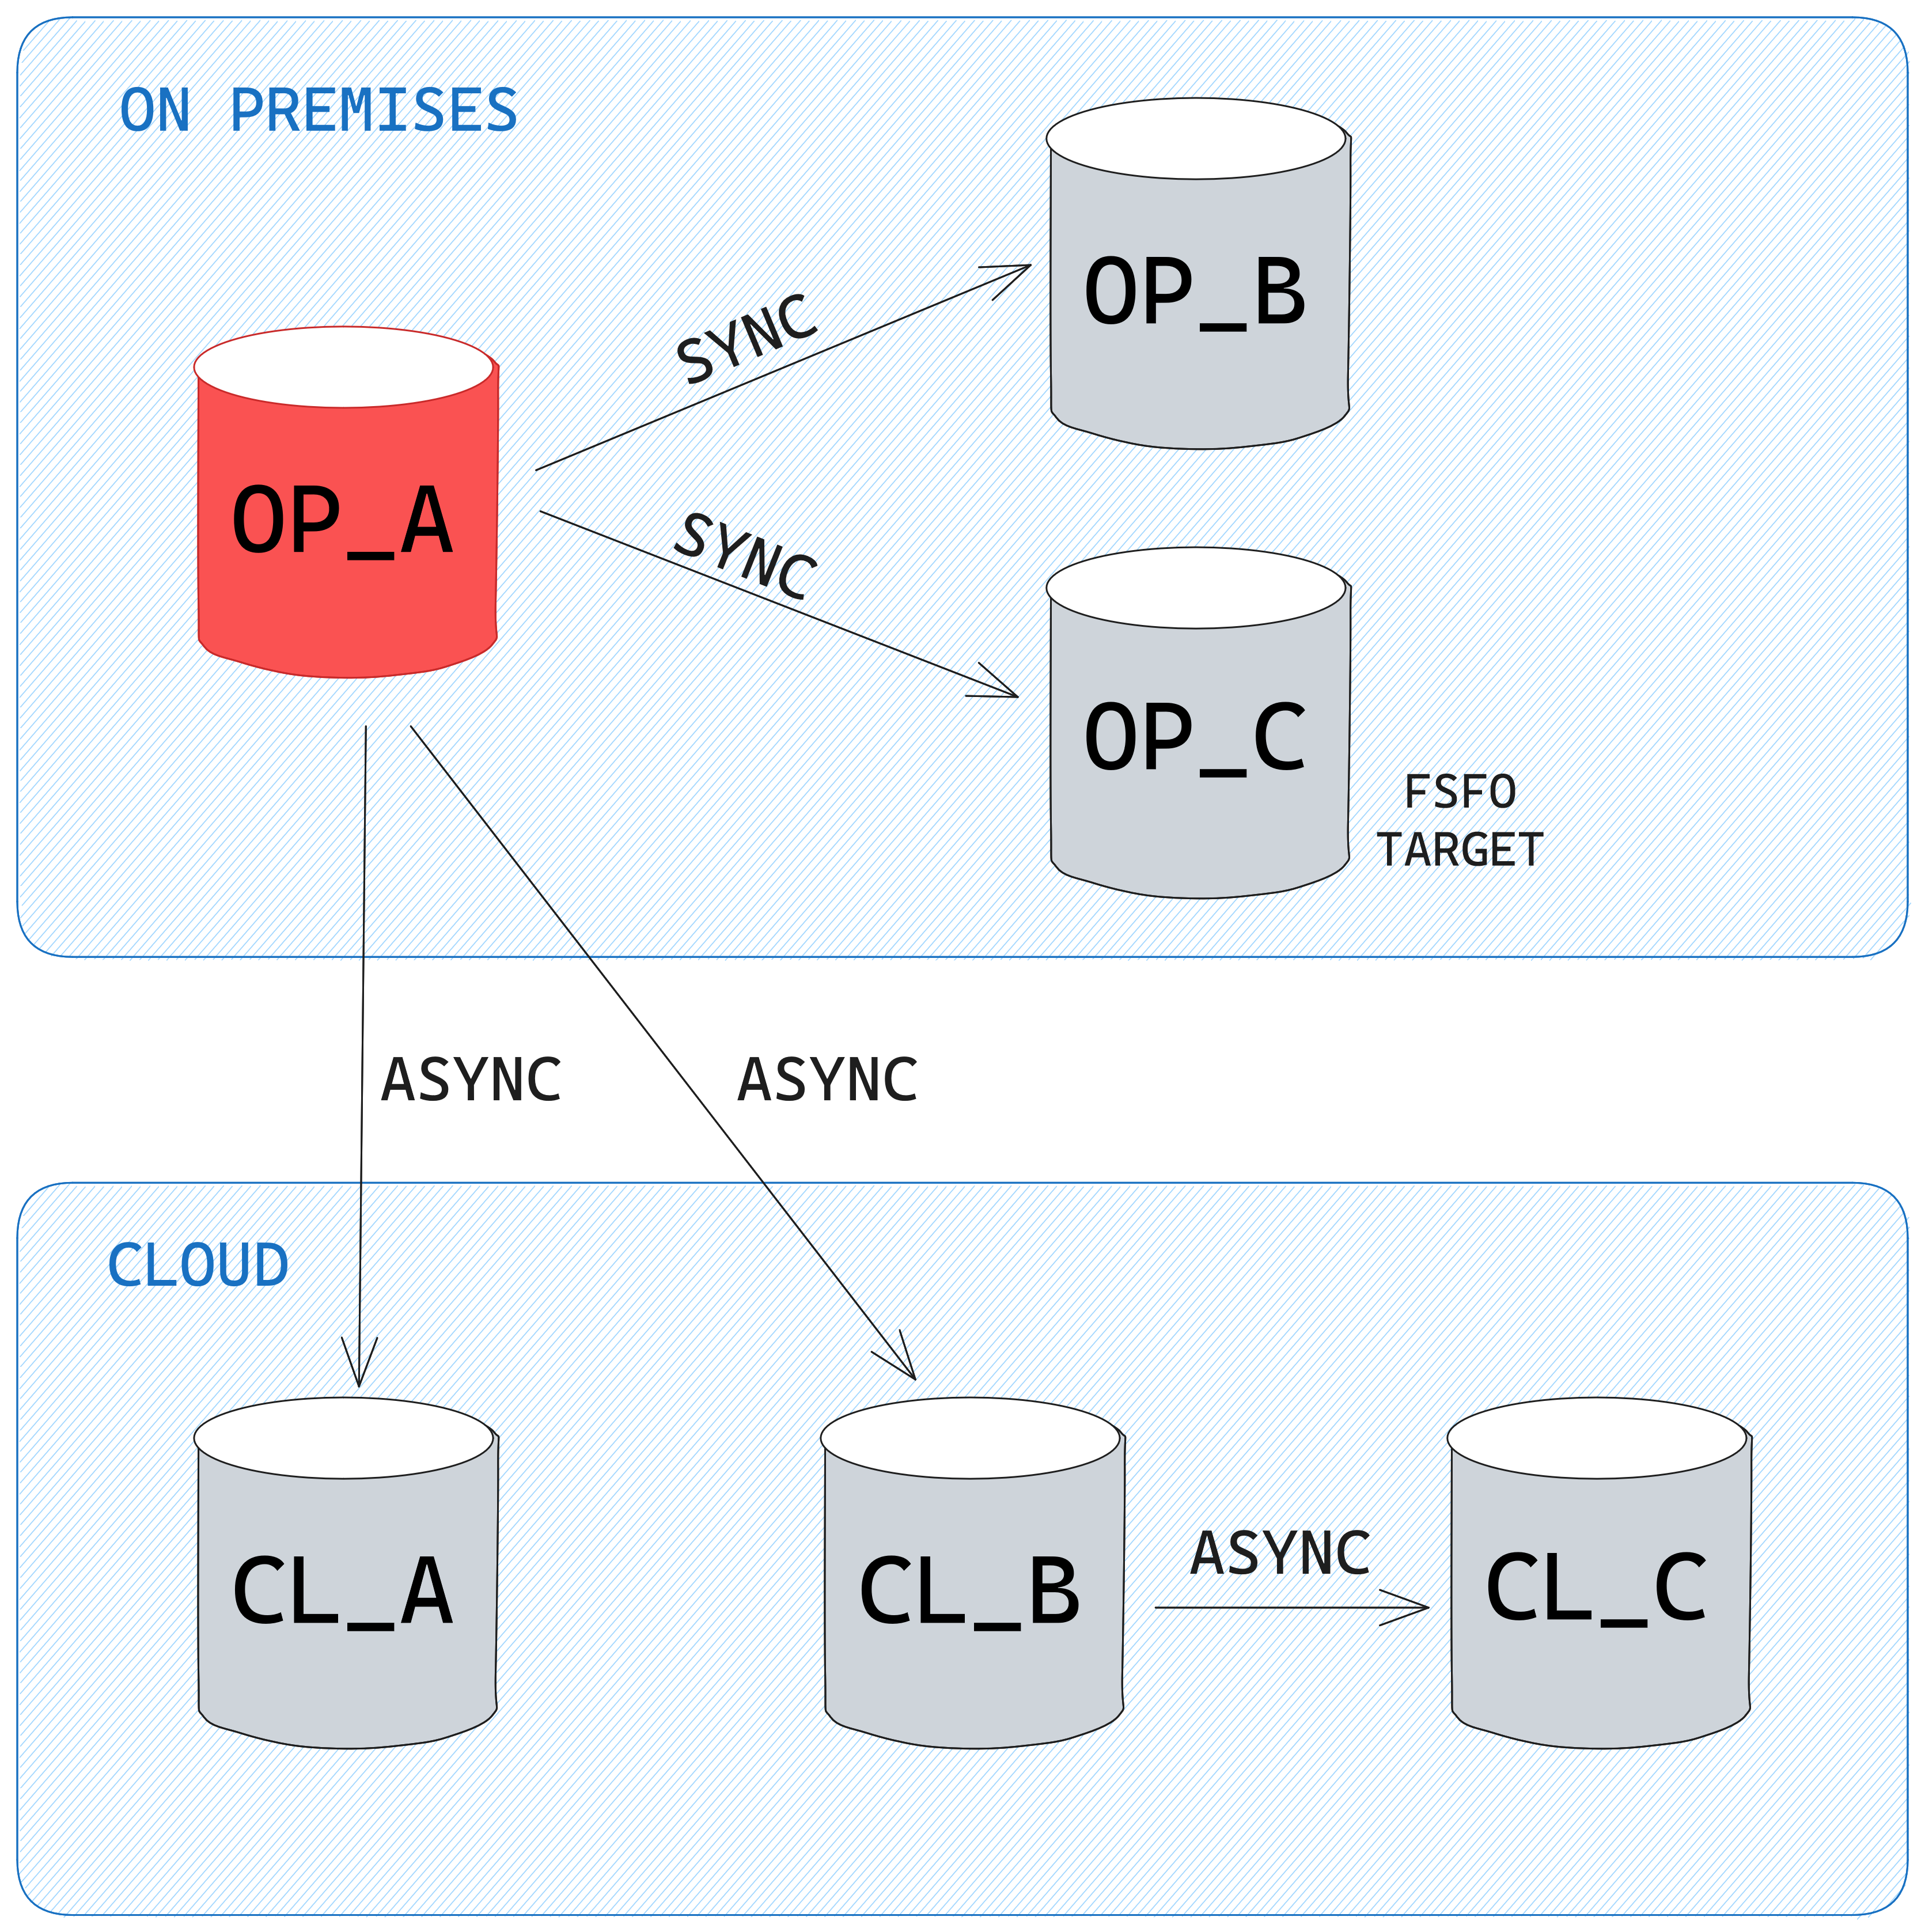
The client setup consisted of 6 databases: 1 primary (OP_A) and 2 standbys (OP_B, OP_C) in the on-premises data center, and 3 standbys in the cloud environment (CL_A, CL_B, and CL_C). The primary database OP_A is sending redo to OP_B and OP_C in SYNC AFFIRM mode and to CL_A and CL_B in ASYNC NOAFFIRM mode. In order to save on network bandwidth, the redo to CL_C is sent from CL_B in a "manual" cascaded standby mode by configuring the log_archive_dest_N parameter.
Desired Data Guard setup after the switchover
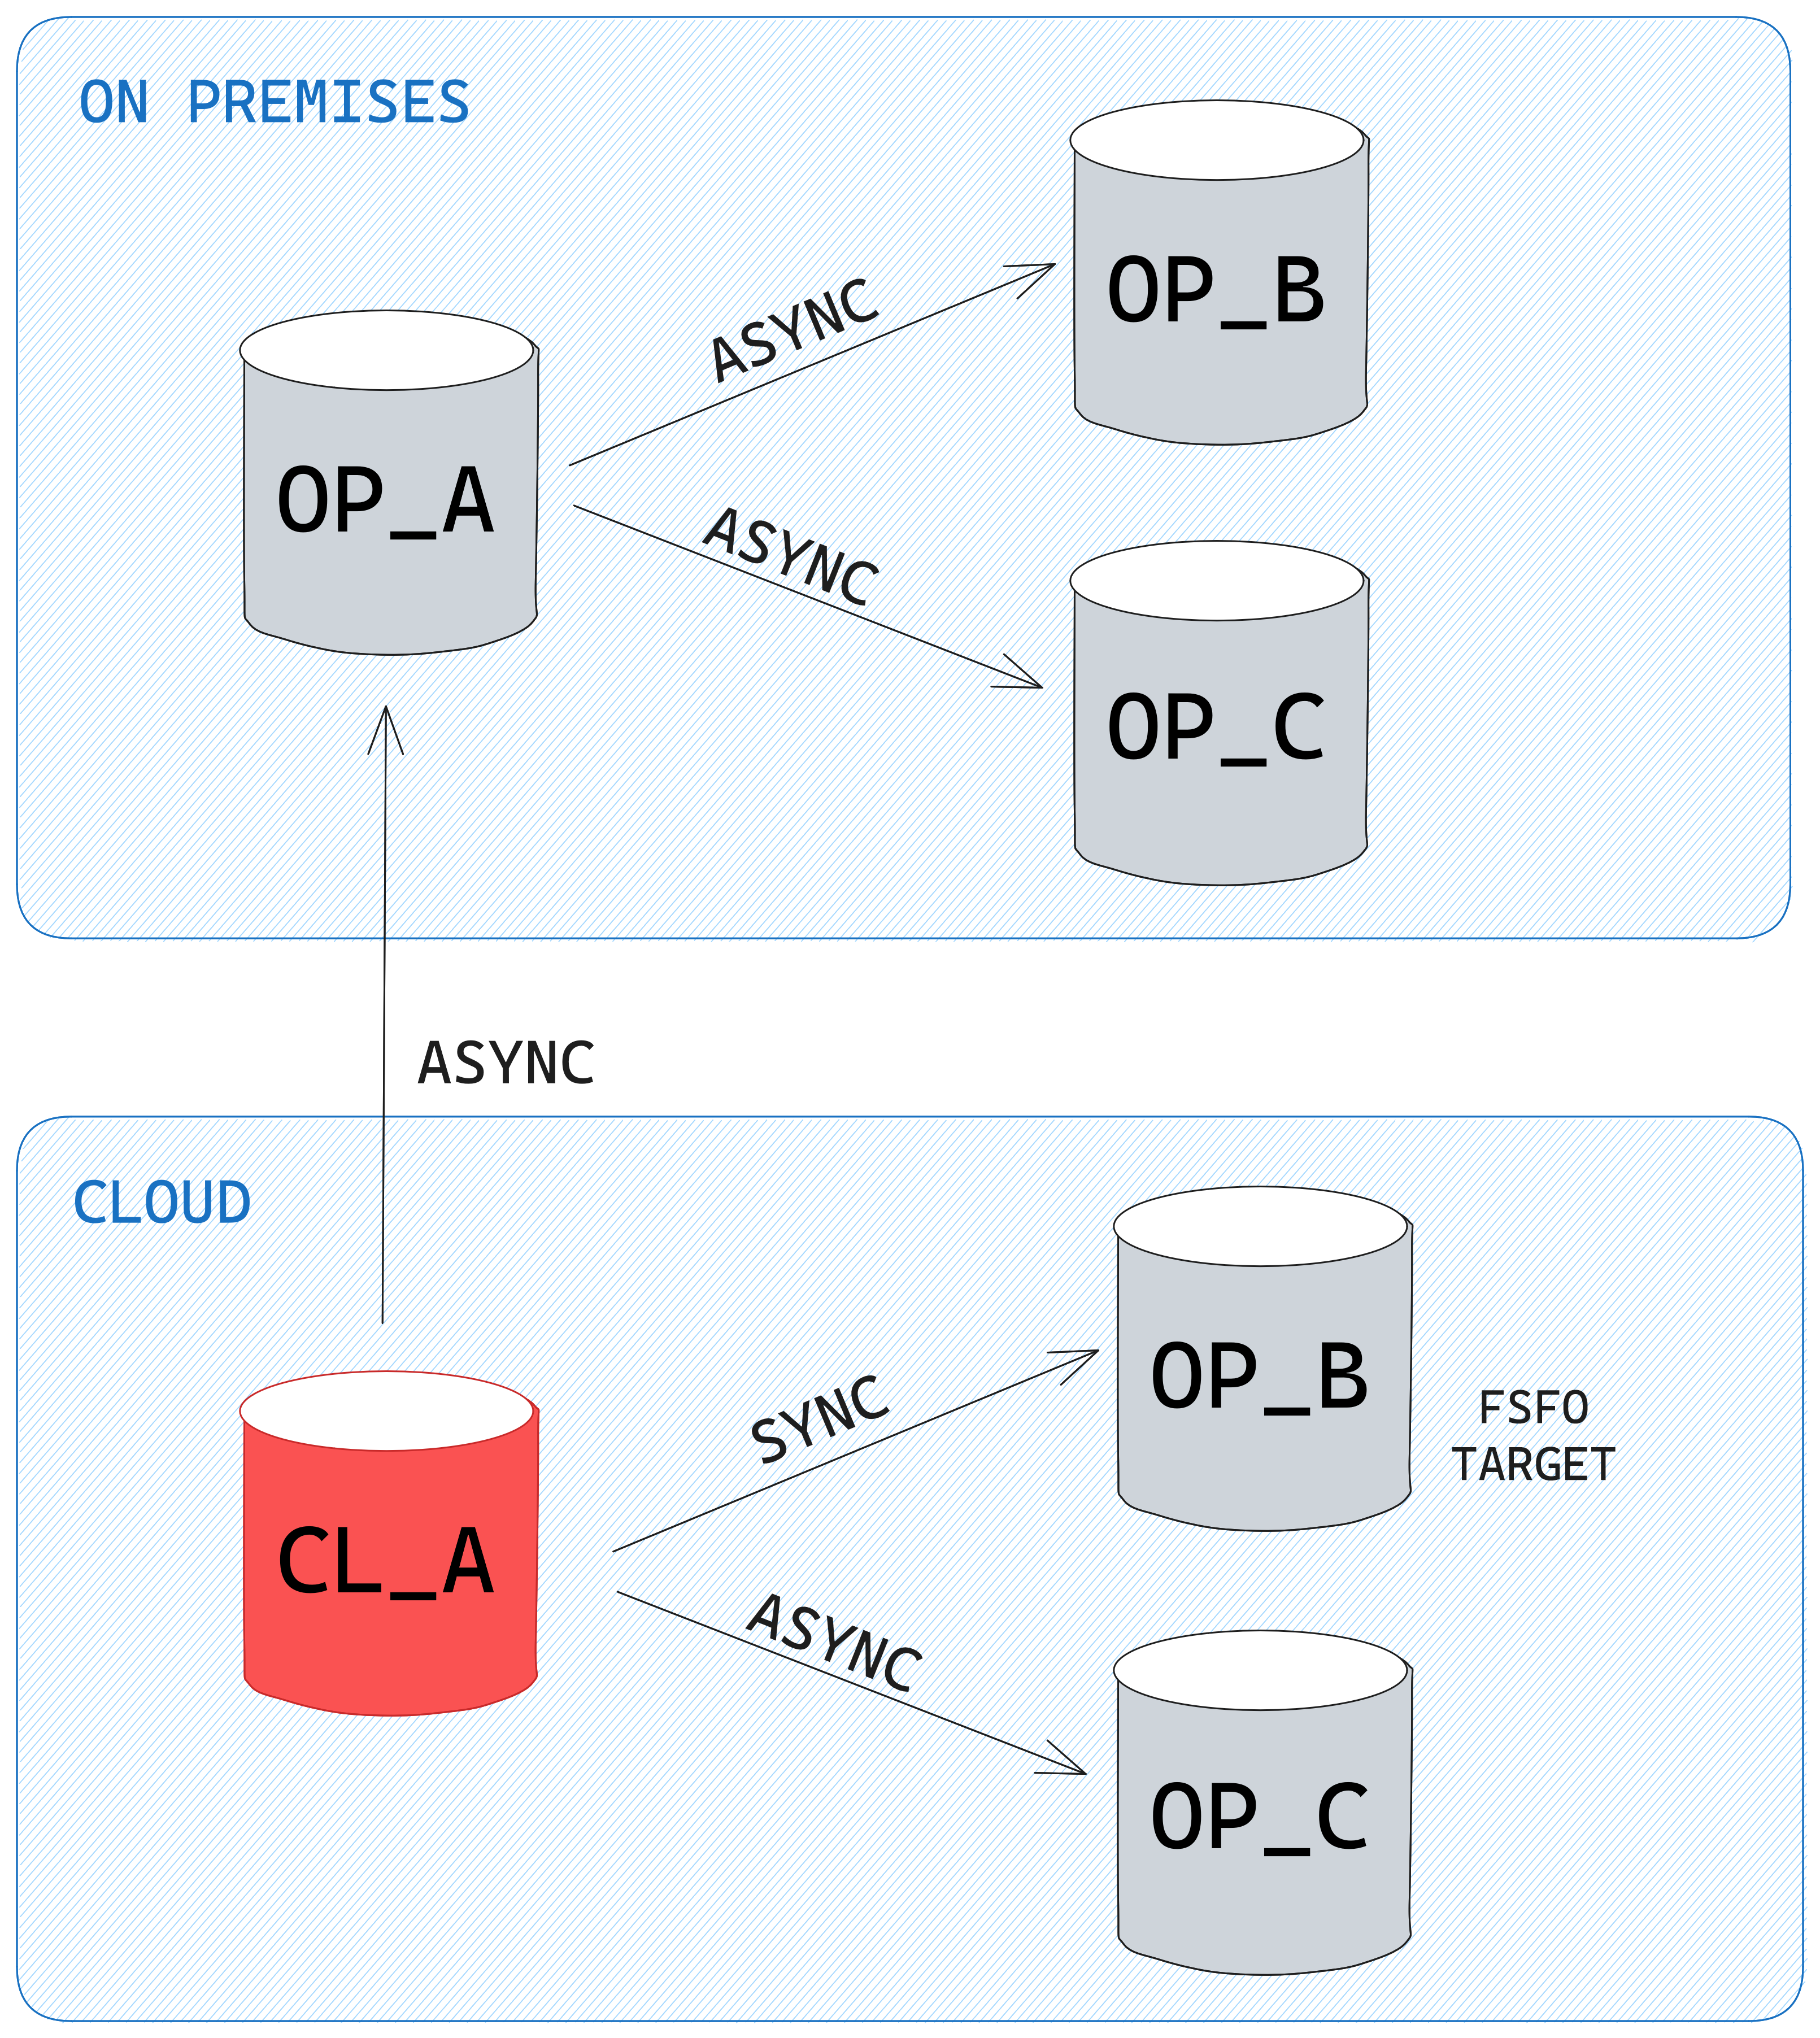
After the switchover, CL_A is the new primary, and redo shipping is configured as per the below diagram. Since the OP_B and OP_C databases were planned to be decommissioned in the near future, and in order to save on network bandwidth, the OP_A standby will be sending redo to them in a cascaded standby way by manually configuring the log_archive_dest_N parameters:
Switchover and the appearance of "log file sync" waits
The switchover went without problems, and the application servers connected to the new primary CL_A. Checking the status on the whole database using Tanel Poder's snapper script, there were 2.6 sessions on CPU, and a bunch of others waiting on waits related to foreground sessions waiting for LGWR to complete its writes (log file sync), and LGWR-related waits:
Session level breakdown...

Sampling SID all with interval 5 seconds, taking 1 snapshots...
account---------------------------------------------------------------------------------------------------------------
  ActSes   %Thread | INST | SQL_ID          | SQL_CHILD | EVENT                               | WAIT_CLASS
---------------------------------------------------------------------------------------------------------------
    1.00    (100%) |    1 | 2x9k3ppn9r4x9   | 0         | ON CPU                              | ON CPU
     .83     (83%) |    1 | 5zgkp42j5nqp3   | 0         | ON CPU                              | ON CPU
     .43     (43%) |    1 |                 |           | log file sync                       | Commit
     .40     (40%) |    1 |                 | 0         | LNS wait on SENDREQ                 | Network
     .27     (27%) |    1 |                 | 0         | LGWR-LNS wait on channel            | Other
     .23     (23%) |    1 |                 | 0         | log file parallel write             | System I/O
     .13     (13%) |    1 | 1nwzhp0605cv8   | 1         | enq: TX - row lock contention       | Application
     .13     (13%) |    1 | 5h867tp05vb0s   | 3         | ON CPU                              | ON CPU
     .10     (10%) |    1 | 3mjwqby797aqh   | 2         | ON CPU                              | ON CPU
     .10     (10%) |    1 | 7kdrp5k54xgxb   | 6         | ON CPU                              | ON CPU

--------------------------------------------------------------------------------------------------------
  ActSes   %Thread | INST | EVENT                               | P1                   | WAIT_CLASS
--------------------------------------------------------------------------------------------------------
    2.63    (263%) |    1 | ON CPU                              |                      | ON CPU
     .40     (40%) |    1 | LNS wait on SENDREQ                 | 0                    | Network
     .27     (27%) |    1 | LGWR-LNS wait on channel            | 0                    | Other
     .23     (23%) |    1 | log file parallel write             | 2                    | System I/O
     .13     (13%) |    1 | enq: TX - row lock contention       | 1415053316           | Application
     .03      (3%) |    1 | log file sync                       | 4134                 | Commit
     .03      (3%) |    1 | log file sync                       | 6835                 | Commit
     .03      (3%) |    1 | log file sync                       | 11589                | Commit
     .03      (3%) |    1 | log file sync                       | 5504                 | Commit
     .03      (3%) |    1 | log file sync                       | 10542                | Commit
During the time the database was being monitored, the performance was acceptable. However, in the days following the switchover, there were occasional increases in application response time. Live monitoring and analyzing AWR data revealed that the wait times for the "log file sync" wait event were occasionally spiking up. The following graphs show that the cumulative and average "log file sync" wait time increased significantly after the switchover in June. At the same time, the number of waits didn't change, so the transaction activity was comparable to the one before the switchover.
Note: Unless specifically stated, all of the graphs that are based on AWR data represent delta values of 15-minute intervals AWR snapshots. The vertical dotted red line indicates the time of the switchover.
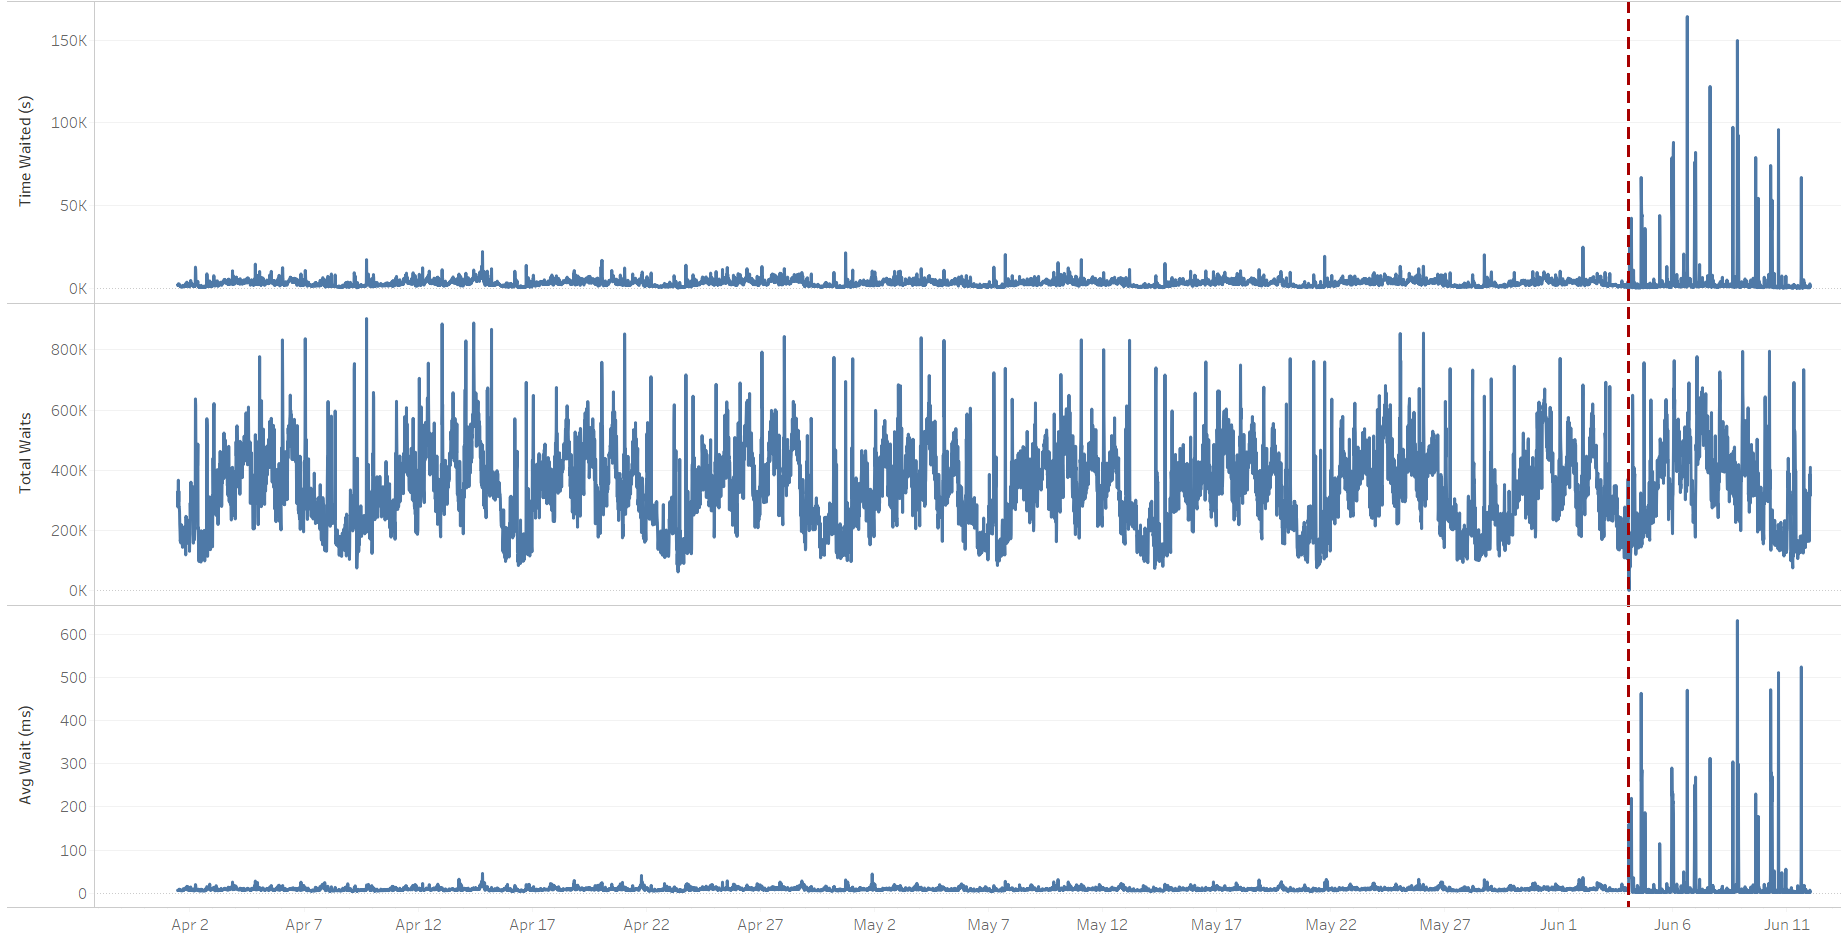
"log file sync" wait event trend
This is how the log file sync's wait profile and histogram looked like for two comparable 15-minute time periods. Both AWR snapshots start at the same time, but one is from a Thursday before the switchover, and the other one is from a Thursday after the switchover:
-- Before the switchover:

                                           Avg
                                        %Time Total Wait    wait    Waits   % DB
Event                             Waits -outs   Time (s)    (ms)     /txn   time
-------------------------- ------------ ----- ---------- ------- -------- ------
log file sync                   377,173     0      4,297      11      1.1   39.9

                                                    % of Waits
                                  -----------------------------------------------
                           Total
Event                      Waits   <1ms  <2ms  <4ms  <8ms <16ms <32ms  <=1s   >1s
-------------------------- ------ ----- ----- ----- ----- ----- ----- ----- -----
log file sync              376.2K    .0    .7  13.1  30.7  38.1  13.8   3.7


-- After the switchover:

                                                             Avg
                                        %Time Total Wait    wait    Waits   % DB
Event                             Waits -outs   Time (s)    (ms)     /txn   time
-------------------------- ------------ ----- ---------- ------- -------- ------
log file sync                   348,922     0    164,141     470      1.1   85.7


                                                    % of Waits
                                  -----------------------------------------------
                           Total
Event                      Waits   <1ms  <2ms  <4ms  <8ms <16ms <32ms  <=1s   >1s
-------------------------- ------ ----- ----- ----- ----- ----- ----- ----- -----
log file sync              347.2K    .0   6.0  29.2   5.5   4.2   5.8  42.1   7.2


                           Waits
                            4s
Event                      to 2m   <2s   <4s   <8s  <16s  <32s  < 1m  < 2m  >=2m
-------------------------- ----- ----- ----- ----- ----- ----- ----- ----- -----
log file sync              23.5K  93.2   1.7   5.1
What stands out is the 42-fold increase in the average wait time, going from 11 ms to 470 ms. The last line of the above output indicates there are waits taking between 4s and 8s to complete, which are big outliers, and several orders of magnitude larger than we'd usually expect for a "log file sync" duration. To be precise, approx. 1200 waits (5.1% of 23.5k) took between 4s and 8s, and that's 0,34% (1200/348,922*100) of all the "log file sync" waits. These abnormally high log write times were also detected by logwriter on the primary database:
*** 2023-06-06 22:28:03.682

Warning: log write elapsed time 524ms, size 3000KB


*** 2023-06-06 22:28:35.013

Warning: log write elapsed time 505ms, size 2157KB


*** 2023-06-06 22:28:35.973

Warning: log write elapsed time 958ms, size 5316KB


*** 2023-06-06 22:28:37.151

Warning: log write elapsed time 1177ms, size 7342KB


*** 2023-06-06 22:28:45.087

Warning: log write elapsed time 588ms, size 2355KB
Cross-checking with the number of transactions (commits, rollbacks) as they are directly related to the "log file sync" wait, their volume is comparable to the pre-switchover time, though we can notice some unusual spikes in the amount of redo written per second:
![]()
The wait on "log file sync" accounts for the time the foreground session waits for the logwriter process to write the log buffer to the log file, which is, in turn, accounted for by the "log file parallel write" event. However, the cumulative waits on that event actually decreased after the switchover, meaning that writing to local redo log files shouldn't be the cause of high "log file sync waits":
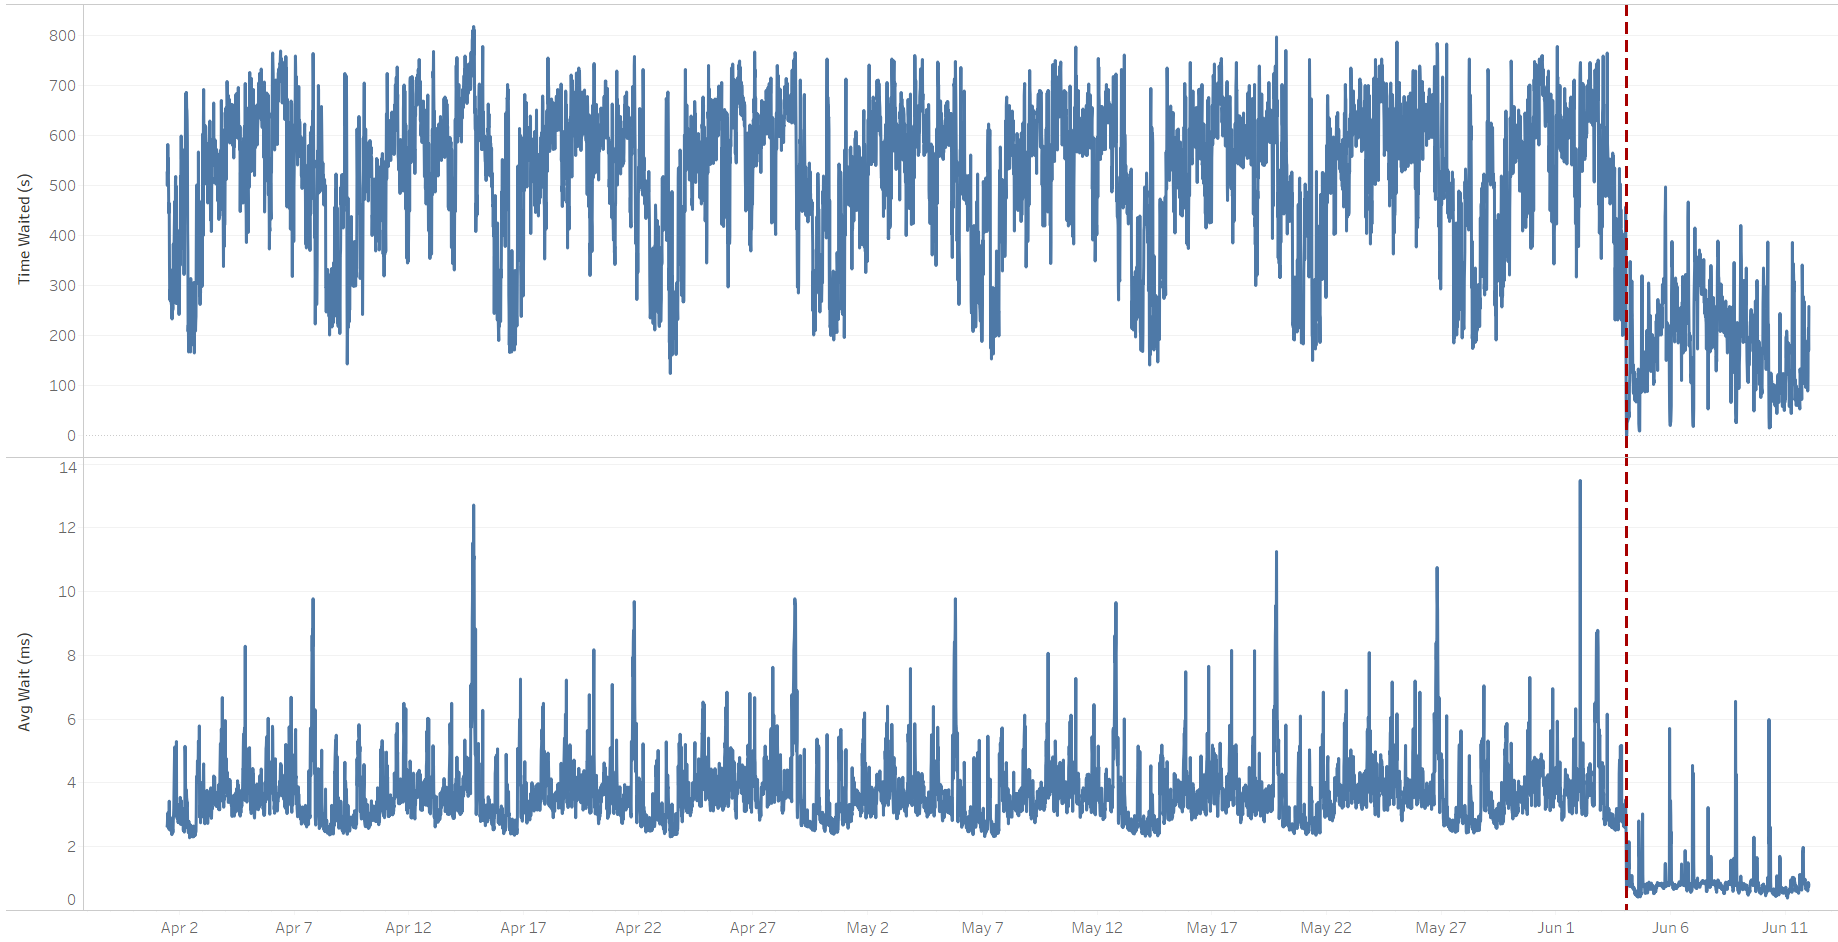
"log file parallel write" wait event trend
There could be various reasons for high waits on "log file sync", such as CPU starvation, but in our case that wasn't the reason. Instead, the wait events shown above ("LNS wait on SENDREQ","LGWR-LNS wait on channel") indicate there's some waiting related to redo transfer to the standby(s). The shipping of redo to the CL_B standby was defined as "SYNC AFFIRM", meaning that the redo has to be shipped and written to the standby's redo logs before the primary can declare the transaction as being committed. All of this time is being accounted for in the primary's "log file sync" wait event. So if there's a problem on the network between CL_A->CL_B, or if the CL_B standby has I/O issues, this will affect transaction times on CL_A.
Side note: Here's a very interesting and informative video that I highly recommend watching (skip to 50:13 for a graphical representation of the concept) where Toon Koppelaars from Oracle's Real World Performance group explains and illustrates how outliers on critical background processes can affect the "log file sync" wait for the foreground processes experience.
How to proceed?
The easy and "obvious" quick fix would be to change the log transfer method from SYNC AFFIRM to ASYNC NOAFFIRM (we're on 11g, so going with FASTSYNC (SYNC NOAFFIRM) wasn't an option); however, the root cause would still remain unknown. The next task was thus to identify whether the issue was related to possible delays in network transfer between CL_A and CL_B, or whether there was an I/O problem on CL_B.
I didn't have an easy way to test network latency between CL_A and CL_B. The MOS note "Assessing and Tuning Network Performance for Data Guard and RMAN (Doc ID 2064368.1)", contains a Java binary that could be used for this purpose, but I'd need client approval for that. Instead, focusing first on the I/O part, I found a correlation between the increase in log file sync on the CL_A primary and a heavy increase in I/O load on the CL_B standby. This was a strong clue that I/O performance on the standby could be the next thing to investigate.
Investigating I/O on the standby
Following is sar data from CL_B's server (standby) for June 6th. Note how the I/O queue size, I/O response time, and I/O wait time spike up at ~ 2:45 PM and from 10 PM till midnight. This correlates perfectly with the times of increased waits on "log file sync" on the CL_A primary, as shown in the graph above:
$ sar -b -f /var/log/sa/sa06 -s 00:00:00 -e 23:59:00
Linux 3.10.0-1160.83.1.el7.x86_64 (redact_CL_B)        06/06/2023      _x86_64_        (16 CPU)

12:00:01 AM       tps      rtps      wtps   bread/s   bwrtn/s

02:20:01 PM    645.89    145.75    500.14  16649.63  34315.73
02:30:01 PM    790.17    296.57    493.60  19101.55  34043.26
02:40:01 PM   1069.04    702.48    366.56 177197.58  58505.98
02:50:01 PM   1255.85    899.30    356.55 173529.92  50034.31
03:00:01 PM    729.93    136.45    593.48  12611.13  28222.12
.
.
09:50:01 PM    534.14    108.30    425.84   7700.36  19885.35
10:00:01 PM    476.89     68.75    408.14   7283.37  14896.25
10:10:01 PM   1088.93    714.19    374.74 221526.13  25700.94
10:20:01 PM   1055.80    945.11    110.68 248119.71  20580.45
10:30:01 PM    946.64    847.82     98.82 247968.53  13827.08
10:40:01 PM    886.32    812.83     73.49 252727.91  14138.72
.
.

-- Device dev253-1 I/O statistics:
                  DEV       tps  rd_sec/s  wr_sec/s  avgrq-sz  avgqu-sz     await     svctm     %util
.
.
14:30:01     dev253-1    731.86  18794.59  15336.18     46.64      1.46      1.99      0.51     37.52
14:40:01     dev253-1    972.70 176551.16  29011.34    211.33     55.78     57.34      0.90     87.19
14:50:01     dev253-1   1182.31 173112.07  24480.63    167.12     52.18     44.13      0.70     82.95
15:00:01     dev253-1    681.79  12348.01  11630.85     35.17      0.93      1.36      0.55     37.40
15:10:01     dev253-1    760.70  27010.68  15151.62     55.43      4.72      6.20      0.56     42.81
15:20:01     dev253-1    676.66  19957.70  11678.80     46.75      2.90      4.29      0.58     39.37
.
.
21:40:01     dev253-1    500.03   7858.04  10875.67     37.47      0.41      0.82      0.64     31.82
21:50:01     dev253-1    507.36   7696.20  10264.35     35.40      0.35      0.69      0.56     28.57
22:00:01     dev253-1    464.65   7283.26  10370.20     37.99      0.33      0.70      0.58     27.05
22:10:01     dev253-1   1058.28 221517.54  14310.22    222.84     31.05     29.34      0.70     73.96
22:20:01     dev253-1   1019.13 247850.70   8587.06    251.62     54.53     53.50      0.98    100.00
22:30:01     dev253-1    917.35 246849.62   8993.50    278.89     67.72     73.81      1.09    100.00
22:40:01     dev253-1    861.16 252280.65   4078.80    297.69     72.40     84.08      1.16    100.00
22:50:02     dev253-1    753.36 252828.30   3637.83    340.43     83.21    110.44      1.33    100.00
23:00:01     dev253-1    738.69 253587.31   2798.34    347.08     77.39    104.77      1.35    100.00
23:10:01     dev253-1    657.82 253893.35   2477.08    389.73     82.68    125.68      1.52    100.00
23:20:02     dev253-1    653.83 252839.67   3621.79    392.25     87.38    133.63      1.53    100.00
23:30:01     dev253-1    655.74 252010.94   4382.86    391.00     83.17    126.84      1.52    100.00
23:40:01     dev253-1    713.32 252081.54   4271.87    359.38     84.93    119.08      1.40    100.00
23:50:01     dev253-1   2102.19 173289.72  32952.97     98.11     33.45     15.90      0.43     91.28
Notice how svctime is relatively low all the time (max. 1.53 ms), but await is 100+ ms during the peak time? In Linux, "svctime" represents the time the I/O device takes to complete the actual I/O operation. On the other hand, "await" is "svctime + time spent in the queue". This is an indication that most of the time I/O requests were waiting in the queue waiting to be issued to the disk and that the high response time wasn't due to disks not being able to deliver the requested I/O, but because the requests were waiting in the queue (avgqu-sz).
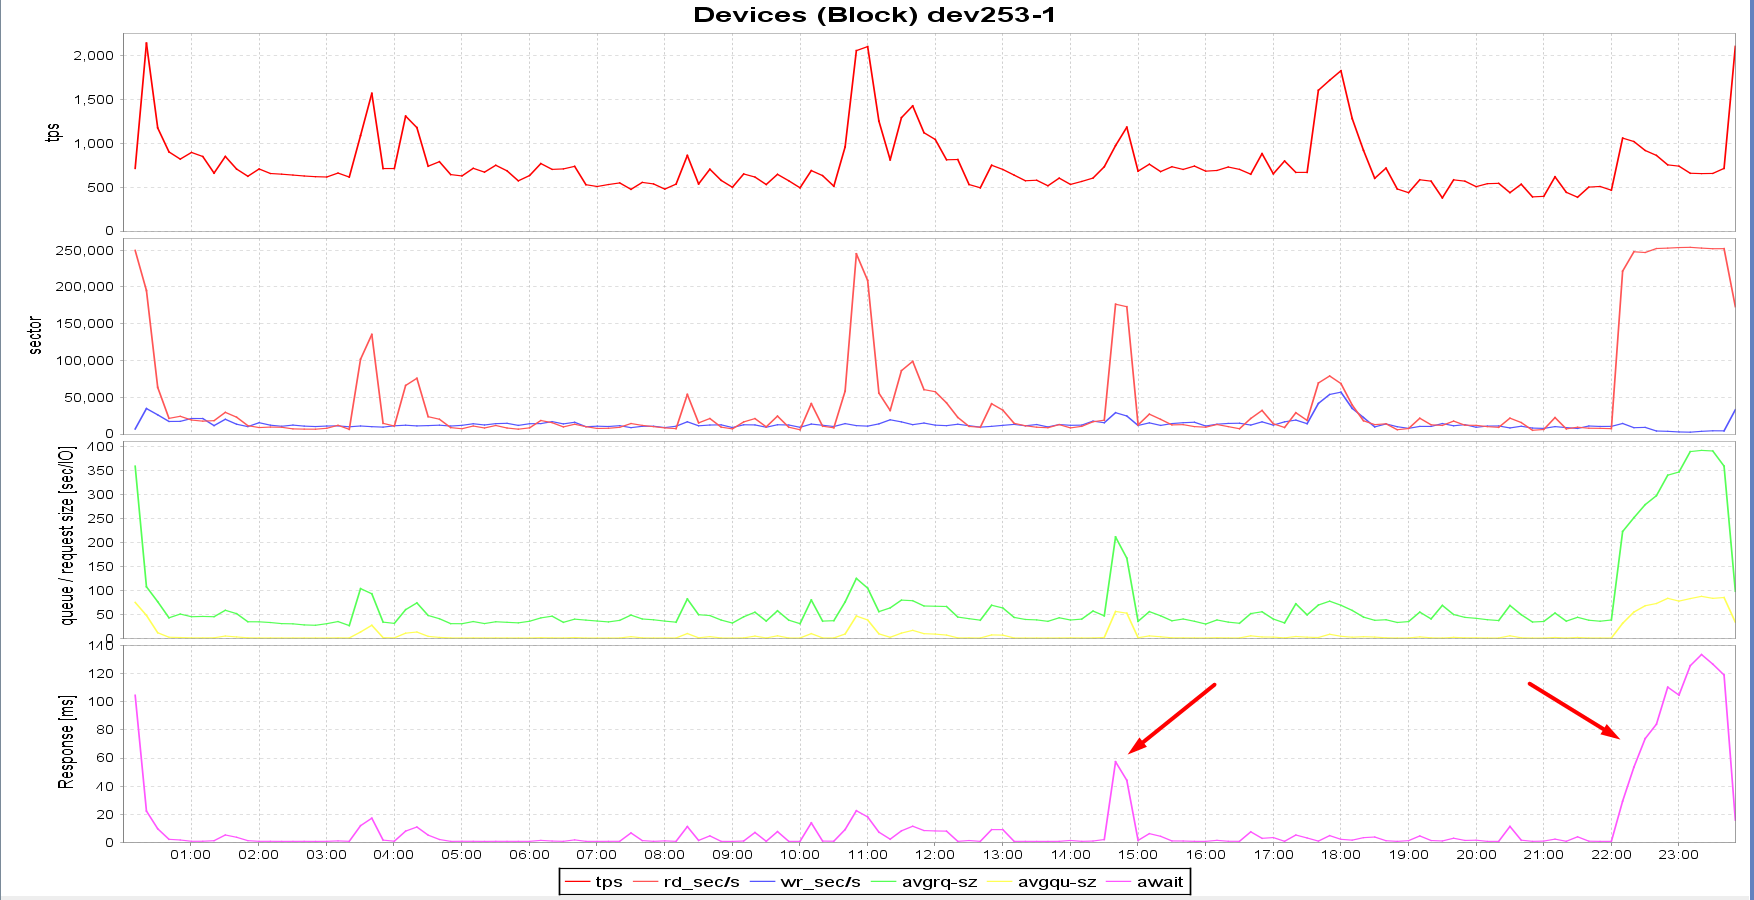
CL_B standby server I/O spikes
CL_B standby server I/O spikes
Cross-checking the same sar statistics from the CL_A's server (primary), there wasn't any relevant load during those time periods. At 10 PM, there's the Oracle standard maintenance window where statistics are being gathered, but otherwise, the workload on the CL_A database was steady. Also, even before the switchover, the OP_A database was shipping its redo to the OP_B and OP_C standbys in SYNC AFFIRM mode, and the issue wasn't present.
Why is there an increase in I/O requests in CL_B?
The next task was to find out why there was this sudden increase in I/O requests on the CL_B standby. In-memory ASH was unfortunately already aged out for June 6th, so instead, I checked for a similar high I/O event for June 7th. It showed that Oracle was waiting on reading database blocks that needed to be changed as part of recovery:
SQL> select to_char(sample_time, 'dd.mm.yyyy hh24:mi:ss') sample_time, user_id, session_state, event, module, action, sql_id, program
from v$active_session_history
where sample_id = 509365;

SAMPLE_TIME            USER_ID SESSION EVENT                                      MODULE                            PROGRAM
------------------- ---------- ------- ------------------------------------------ --------------------------------- ---------------------------------
07.06.2023 14:44:31          0 WAITING db file parallel read                                                        oracle@redact_CL_B  (PR01)
07.06.2023 14:44:31          0 WAITING db file parallel read                                                        oracle@redact_CL_B  (PR0D)
07.06.2023 14:44:31          0 WAITING db file parallel read                                                        oracle@redact_CL_B  (PR03)
07.06.2023 14:44:31          1 WAITING Standby redo I/O                           oracle@redact_CL_A  (TNS V1-V3)   oracle@redact_CL_A  (TNS V1-V3)
07.06.2023 14:44:31          0 WAITING db file parallel read                                                        oracle@redact_CL_B  (PR04)
07.06.2023 14:44:31          0 WAITING db file parallel read                                                        oracle@redact_CL_B  (PR05)
07.06.2023 14:44:31          0 WAITING db file parallel read                                                        oracle@redact_CL_B  (PR06)
07.06.2023 14:44:31          0 WAITING db file async I/O submit                                                     oracle@redact_CL_B  (DBW0)
07.06.2023 14:44:31          0 WAITING db file parallel read                                                        oracle@redact_CL_B  (PR07)
07.06.2023 14:44:31          0 WAITING db file async I/O submit                                                     oracle@redact_CL_B  (DBW1)
07.06.2023 14:44:31          0 WAITING db file parallel read                                                        oracle@redact_CL_B  (PR08)
07.06.2023 14:44:31          0 WAITING db file parallel read                                                        oracle@redact_CL_B  (PR09)
07.06.2023 14:44:31          0 WAITING db file parallel read                                                        oracle@redact_CL_B  (PR0A)
07.06.2023 14:44:31          0 WAITING db file parallel read                                                        oracle@redact_CL_B  (PR0B)
07.06.2023 14:44:31          0 WAITING db file parallel read                                                        oracle@redact_CL_B  (PR0C)
07.06.2023 14:44:31          0 WAITING db file parallel read                                                        oracle@redact_CL_B  (PR0G)
07.06.2023 14:44:31          0 WAITING parallel recovery change buffer free                                         oracle@redact_CL_B  (PR00)
07.06.2023 14:44:31          0 WAITING db file parallel read                                                        oracle@redact_CL_B  (PR0F)
07.06.2023 14:44:31          0 WAITING db file parallel read                                                        oracle@redact_CL_B  (PR0E)
07.06.2023 14:44:31          0 WAITING db file parallel read                                                        oracle@redact_CL_B  (PR02)

20 rows selected.

SQL>
This lead me to the Oracle support note: "Redo I/O Is Higher On Active Data Guard Physical Standby Than Primary (Doc ID 2249431.1)", which suggests that the waits present on the standby could be related to the parameter DB_LOST_WRITE_PROTECT set to TYPICAL. And indeed, all of the databases present in the DG configuration had DB_LOST_WRITE_PROTECT=TYPICAL. Though the question remains - why did the issue start to happen after the switchover, since the setting was in place even before the switchover, and the workload didn't change?
The DB_LOST_WRITE_PROTECT parameter
The next step was to verify what and how DB_LOST_WRITE_PROTECT=TYPICAL affects the behavior of the primary and standby. The "DB_LOST_WRITE_PROTECT" section of the MOS note "Best Practices for Corruption Detection, Prevention, and Automatic Repair - in a Data Guard Configuration (Doc ID 1302539.1)", essentially explains that physical reads on the primary database can cause increased/additional redo logging (Block Read Redo, BRR), and that redo apply might be impacted due to additional data block read I/Os. The additional redo is logged only for physical reads on the primary. After enabling DB_LOST_WRITE_PROTECT on a physical standby database, you will encounter an increase in physical reads, especially for data that is updated very infrequently but read semi-frequently (forcing a physical read) on the primary database. Note "Redo I/O Is Higher On Active Data Guard Physical Standby Than Primary (Doc ID 2249431.1)" further explains that these additional BRR records are only generated for physical reads into the buffer cache and not by direct path reads.
Based on the above, in case there's an increase in the amount of physical reads on the primary, this can affect the standby's I/O volume. Also, as stated, direct path reads don't count here, only physical reads to the buffer cache are problematic. This behavior could, in turn, affect the primary commit times, which, among others, are sensitive to the standby's I/O performance since it's shipping redo in SYNC AFFIRM mode. The note mentions an increase in the "redo size for lost write detection" statistic, and indeed, after the switchover from OP_A->CL_A, it increased, as did the amount of "physical reads cache", i.e. reads to the buffer cache. Spikes of both statistics correlate:
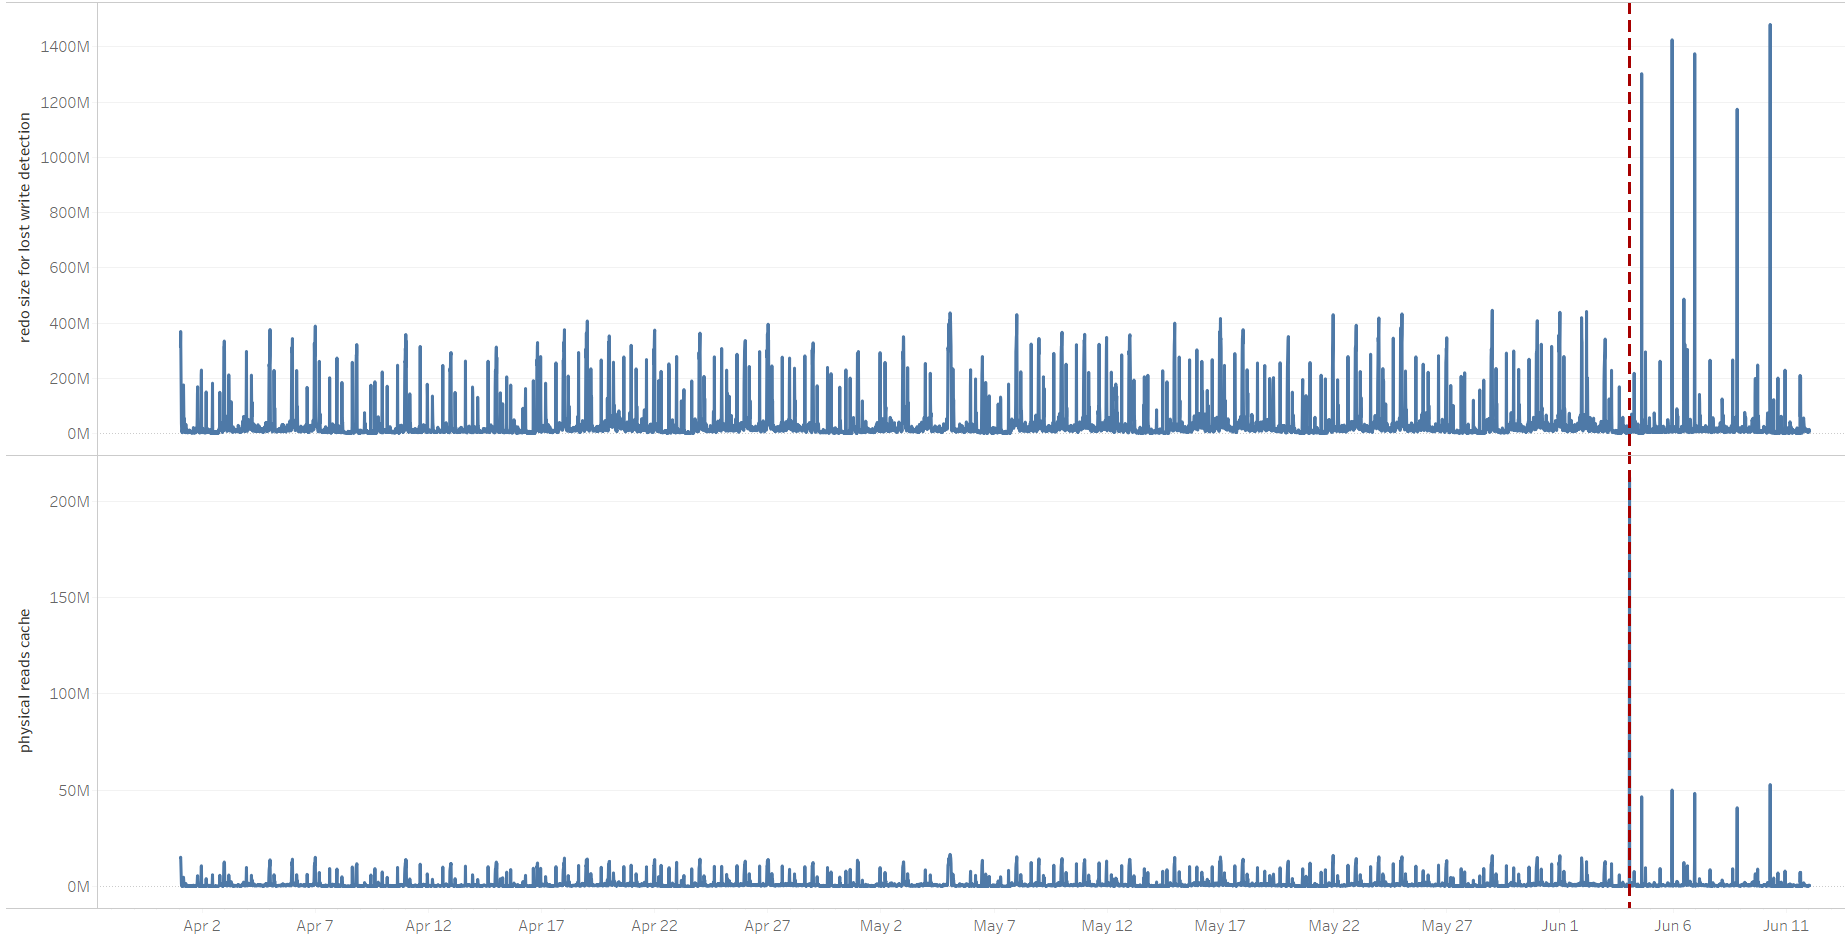
"redo size for lost write detection" and "physical reads cache" correlation
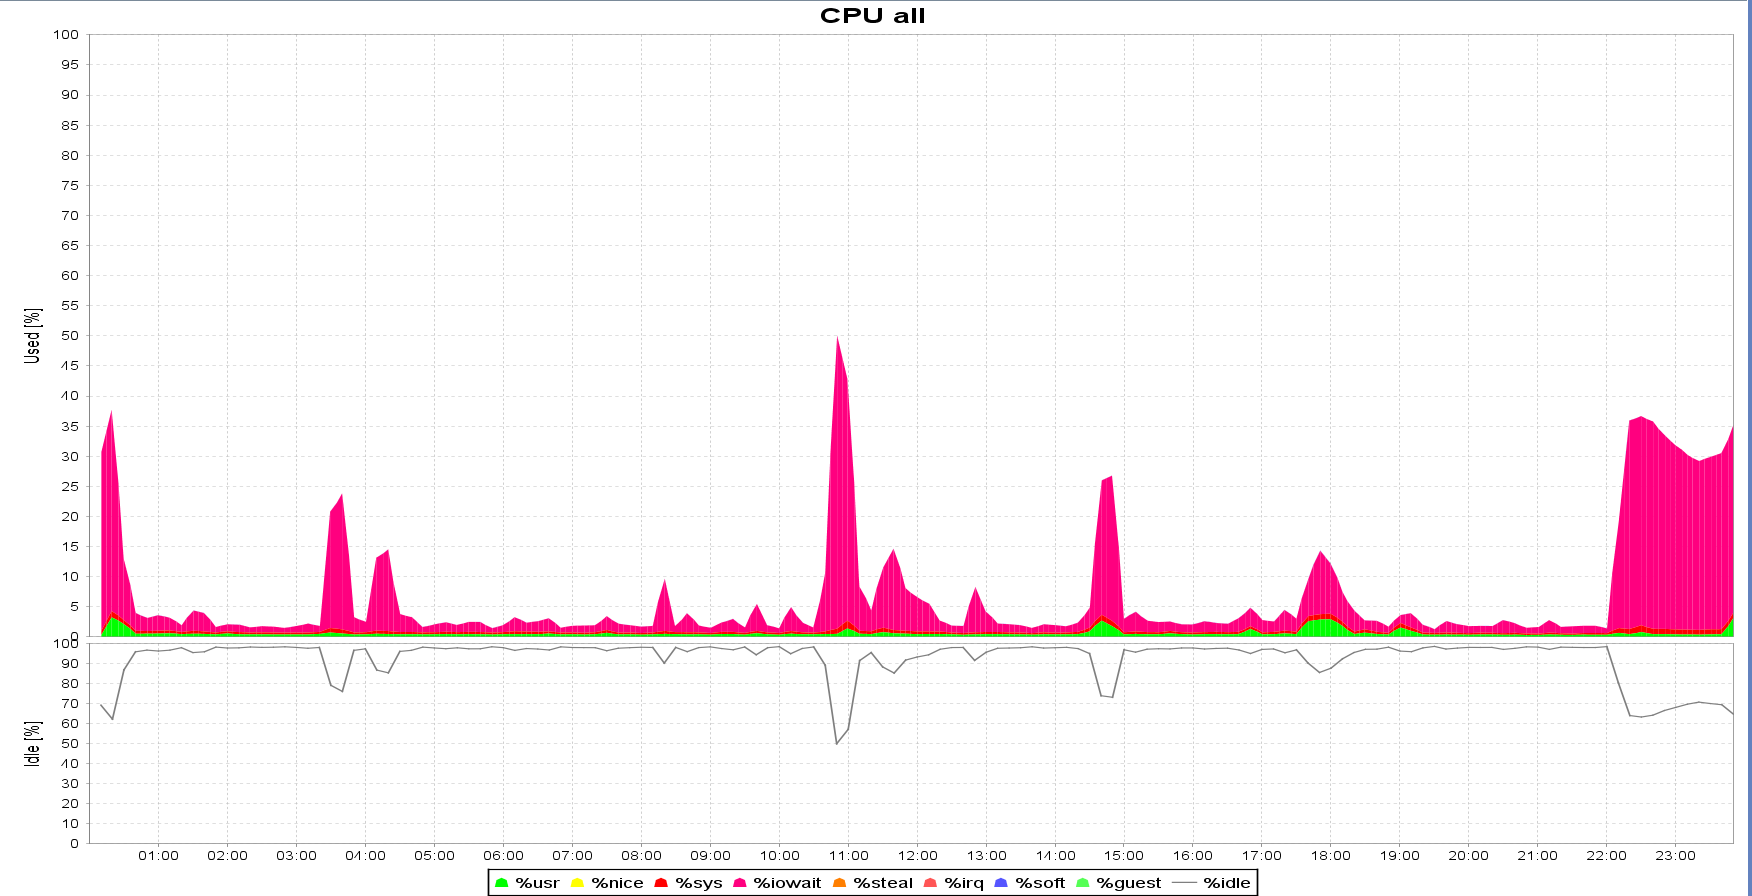
At the time, I didn't go into the details as to why the amount of cached reads increased. A quick check didn't report any significant changes from buffered reads to direct path reads, though focusing only on the period when the stats gathering job was running, it now completed in 30 minutes instead of more than an hour. The time the stats job was running was also one of the periods when the primary experienced high waits on "log file sync". The new system had more CPU power and a faster I/O subsystem, so the most probable explanation was that the same job was completed faster, also generating more redo related to "redo size for lost write detection," as shown in the above graphs.
At this point, another quick fix could be to set DB_LOST_WRITE_PROTECT=NONE on the CL_B standby, though the root cause would still not be found.
Finding the root cause and fixing the problem
As mentioned, among the whole day's activities, the stats gathering job was the time when the "log file sync" issue was most prominent, so I focused the research on those time periods. Since the job was interfering with a critical application workload, the client modified its start time from 10 PM to 7 PM. This didn't fix the issue, it just moved the "log file sync" problem so it manifested 3 hours earlier, but I'm mentioning it so it's clear why I'm focusing the research on 7 PM and not 10 PM.
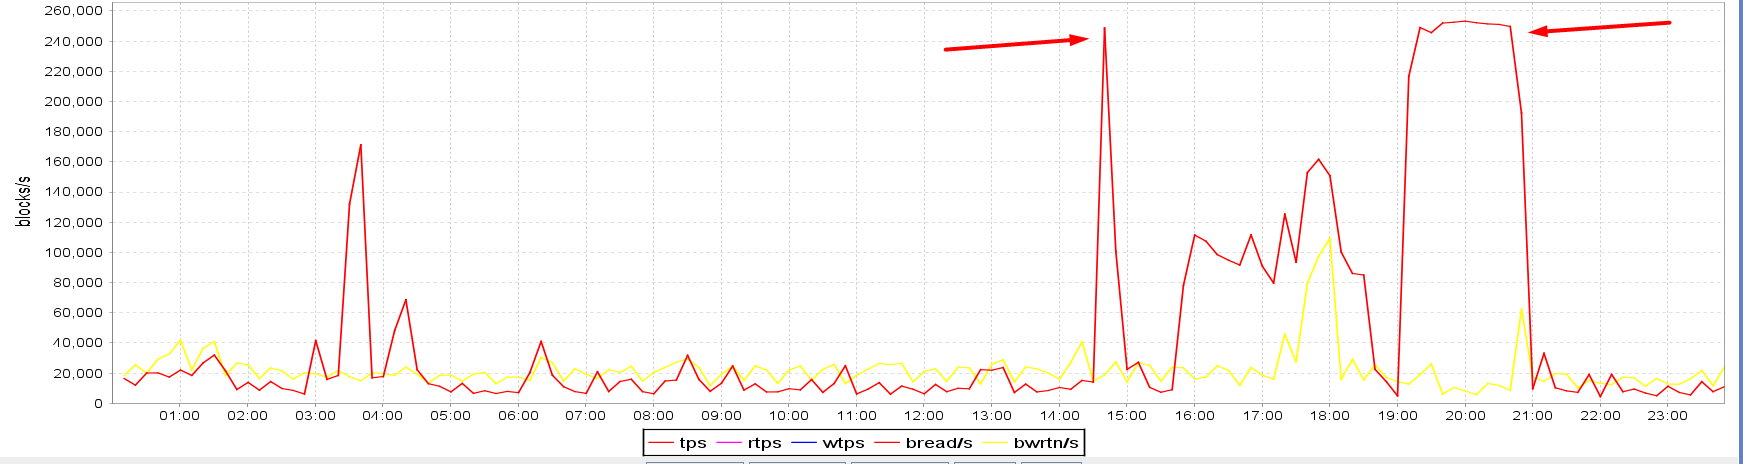
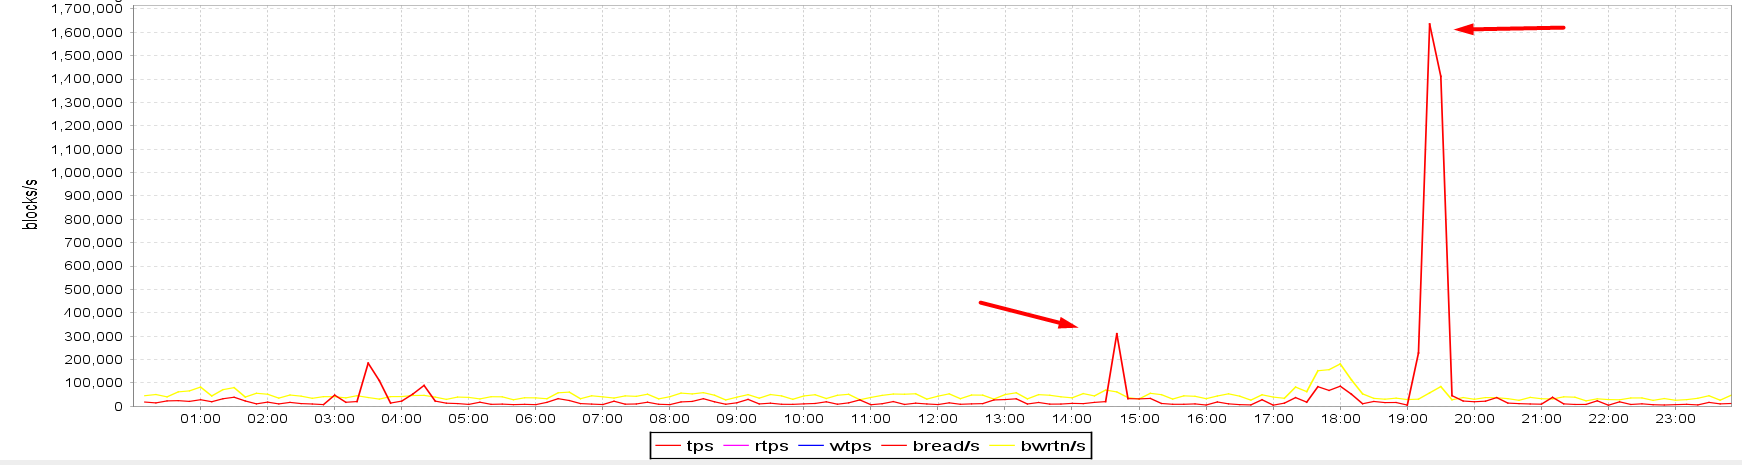
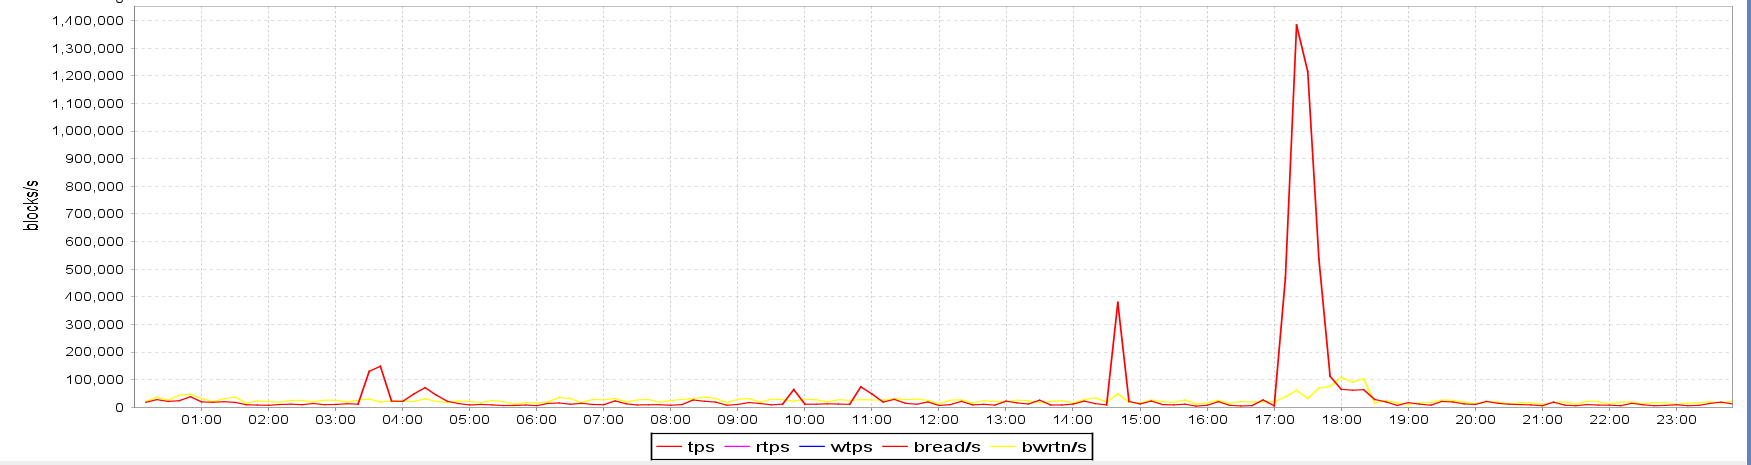
The main clue is in the below graphs obtained from visualizing sar data. The runtime of the stats gathering job on CL_A was from 7 PM till approx. 7:28 PM. The I/O spike on the OP_A standby also lasted just from 7 PM till approx. 7:30 PM, however, the spikes on both CL_B and CL_C standbys were there from 7 PM till 9 PM, so 1.5 hours longer. Note also how the blocks/s figures of both CL_B and CL_C standbys match perfectly, it seems like the amount of IOs was being capped artificially at approx. 250,000 blocks/s. The OP_A standby residing in the on-premises data center seems capable of much more I/O bandwidth than the CL_B and CL_C standbys in the cloud; in fact, 6.4x more. I also highlighted a spike at ~ 2:30 PM so that it can be visually compared to the status on the OP_A standby:
- CL_B standby I/O (cloud):
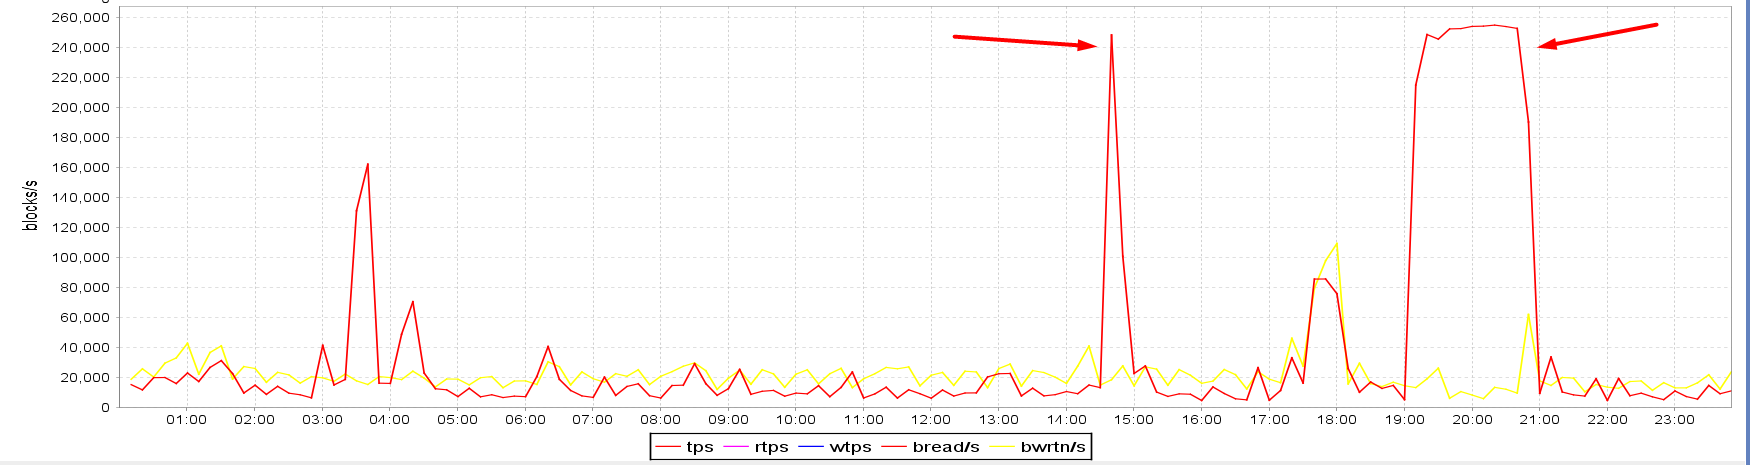
- CL_C standby I/O (cloud):
- OP_A standby I/O (on premises):
Note that even though the CL_C standby's I/O subsystem was suffering from the same issue as CL_B's, it didn't have an impact on the primary since its redo shipping was asynchronous.
As we didn't have access to the cloud's machine web console, my suggestion to the client was to check whether there was any I/O cap on the CL_B standby's storage volumes. Indeed, the client replied that the server hosting the CL_A primary had storage volumes capable of much more IOPS than the ones attached to the CL_B and CL_C standbys. So the IOPS on those two standbys were capped during the periods of higher I/O load. The client configured the storage volumes on both standbys to have the same characteristics as the one on the CL_A primary. After the change was implemented on June 13th, wait times on "log file sync" drastically decreased back to a few milliseconds range. As a curiosity I included the "redo size for lost write detection" statistic, which still presents spikes, but since the standby can now handle the load, it's not a problem for the primary anymore. The displayed values are based on 15-minute AWR snapshots:
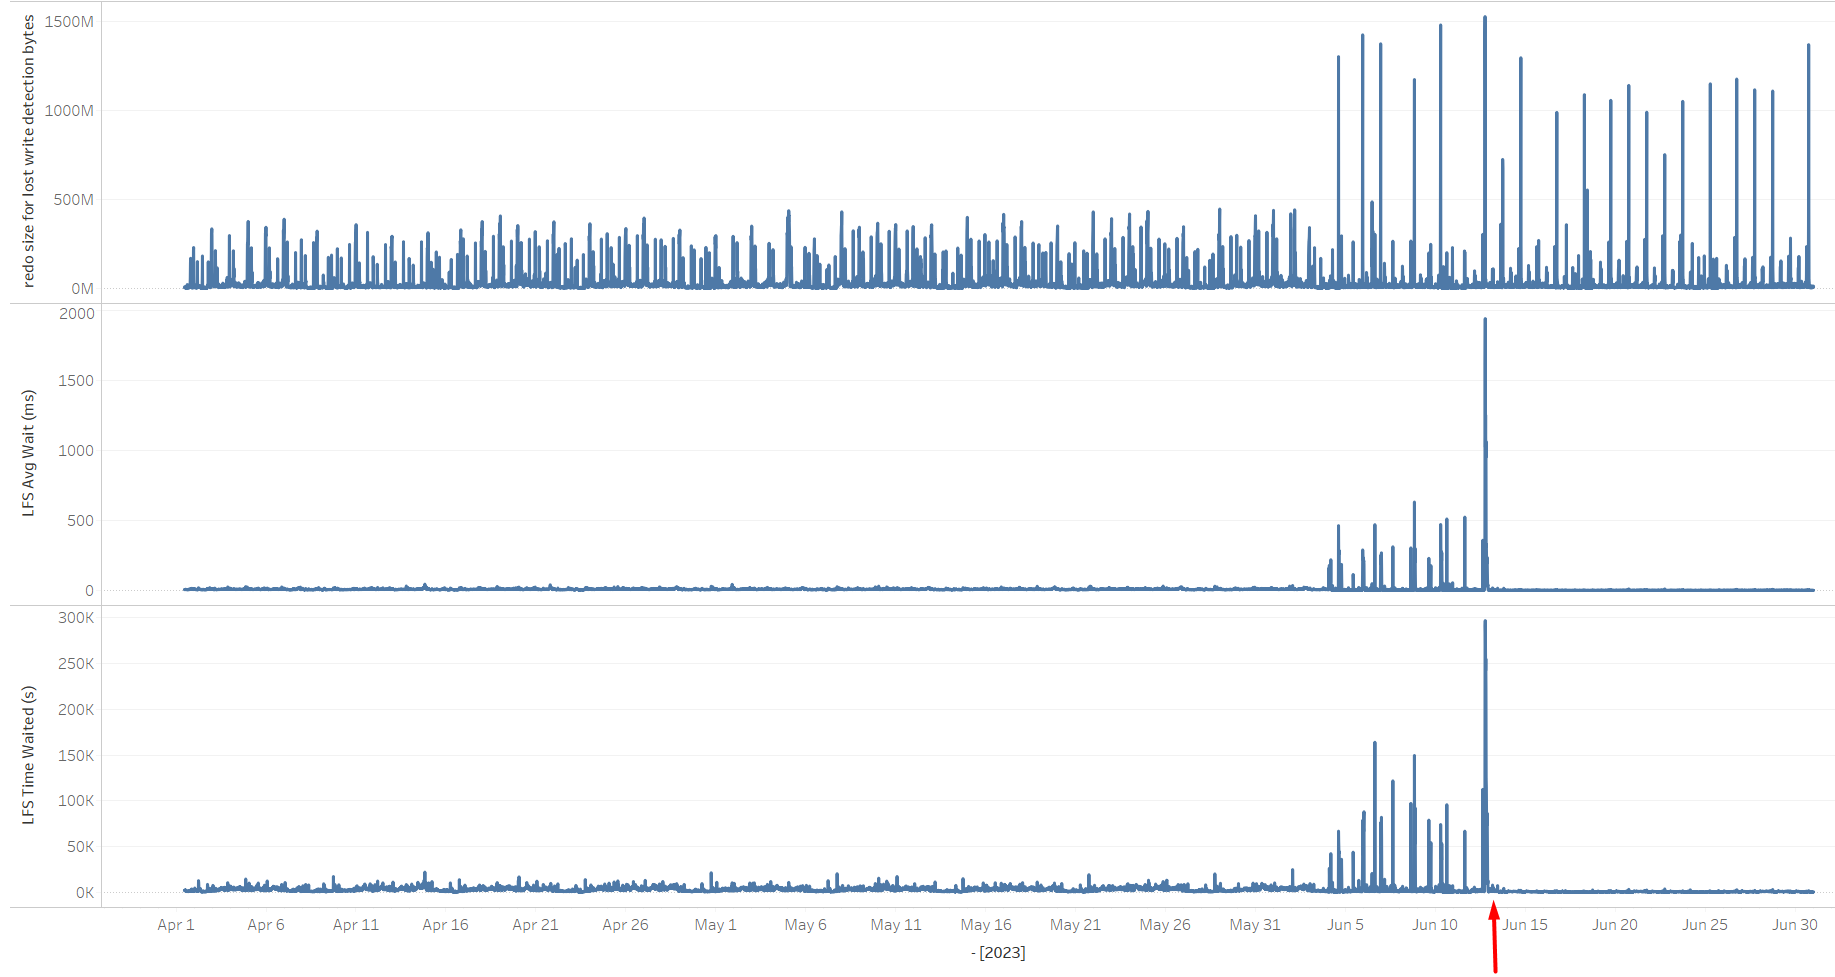
I/O characteristics derived from sar on the CL_B and CL_C standbys also confirmed that the I/O storage subsystem was capable of handling more IOPS. The spikes at ~ 2:30 PM and 7 PM are much shorter now and are comparable in shape to the ones on the OP_A server presented above. The maximum number of blocks/s is also much higher than it used to be before the change:
CL_B server's I/O characteristics after providing a storage volume capable of more IOPS
Summary
The problem with high waits on "log file sync" was related to a combination of events. After the switchover, the primary database in the cloud issued more buffered reads in a shorter time period compared to the on-premises database, presumably due to faster CPUs and I/O subsystem. Due to "DB_LOST_WRITE_PROTECT=TYPICAL", the standby(s) had to read and verify the affected datablocks from their disks. This, in turn, capped out the IOPS on the CL_B and CL_C standby hosts and further slowed down all standby's I/O operations, including writing to redo logs and redo apply. This "backfired" to the primary and affected its commit times, as its redo shipping method to CL_B was set to SYNC AFFIRM.
This post illustrates how following a trail of clues led to the actual root cause of increased commit times on the primary database. Setting the redo transfer mode from CL_A to CL_B to ASYNC NOAFFIRM and/or setting DB_LOST_WRITE_PROTECT=NONE could have temporarily alleviated the problem, though the root cause wouldn't have been found be fixed, which could have caused problems later in case a switchover to CL_B occurred.
Lessons learned
The post hopefully also illustrates that having a standby destination with SYNC AFFIRM redo transfer mode and (optionally) databases with DB_LOST_WRITE_PROTECT=TYPICAL, requires that the standby's storage subsystem is also performant enough to keep up with the primary's performance. I/O capabilities of the primary and standbys meant as a disaster recovery solution should match anyway, since in the event of a switchover/failover to the standby, we might be in for an unpleasant surprise caused by major slowdowns and delays in I/O operations. If the switchover/failover was due to an emergency and failure of the primary, that would probably not be the most appropriate time to start researching why the new primary operates poorly on I/O operations.
Cloud Migrations
Ready to optimize your Oracle environment for the future?