A huge but often overlooked aspect of tuning cluster databases is workload management. That means controlling on which and how many nodes a RAC database should actively work. The default service and most intuitive configuration is to spread the workload evenly over all nodes. If all nodes accept the same number of connections, that usually results in an even distribution of connections and therefor workload. However, this often leads to systems that end up performing worse than a single instance would. I will explain why towards the end of this blog post after a demonstration.
 Snapper confirms that all Cluster related waits have disappeared and the throughput now only seems to be limited by how fast we can commit.
Lab Setup - Oracle Cloud RAC and swingbench
The quickest way for me to demo performance on a cluster database is to use Oracle's RAC DBaaS to configure and spin up a two node cluster. I used the smallest machines with only 4 OCPU cores per node. The version I am using is 12.1 with a single PDB configured. I could have used the service that is created by default for each service but since I cannot modify the properties of that, let's create one for our tests:srvctl add service -db orcl -service sb -pdb PDB1 -preferred orcl1,orcl2
To generate some load I am using swingbench's simple stress test. I simply downloaded and unzipped the software and modified the Stress_Test.xml config file with my connection details and 12 users. Everything else was left at the default, resulting in a workload of 15% Inserts, 40% Selects, 30% Updates and 10% Deletes. (I know those numbers do not add up to 100% but they are the defaults...)
Benchmark results for with load-balancing
So let's fire up the benchmark and see what happens. As this runs for a minute or two, the numbers levels off at just around or slightly over 5000 TPS.[oracle@cluster1 bin]$ ./charbench -v -c ../configs/Stress_Test.xml
Author : Dominic Giles
Version : 2.6.0.1046
Results will be written to results.xml.
Hit Return to Terminate Run...
Time Users TPM TPS
9:20:05 AM 0 0 0
9:20:15 AM 12 5820 3210
9:20:25 AM 12 50202 4497
9:20:35 AM 12 94894 4635
9:20:45 AM 12 143614 4900
9:20:55 AM 12 194960 4664
9:21:05 AM 12 243025 4968
9:21:15 AM 12 287858 4994
9:21:25 AM 12 294665 5076
9:21:35 AM 12 298551 4489
9:21:45 AM 12 298826 5225
9:21:55 AM 12 296454 5027
9:22:05 AM 12 298158 4934
9:22:15 AM 12 296693 5149
While this is running we can confirm that the 12 user sessions are evenly balanced over both nodes:
SQL> select inst_id, count(*) from gv$session where username = 'SB' group by inst_id;

  INST_ID COUNT(*)
 ---------- ----------
 1  6
 2  6
A quick check with snapper shows that all of these sessions are indeed active and also shows CLUSTER as the main wait class:
SQL> @snapper ash=WAIT_CLASS 10 1 user=SB@*
 Sampling SID user=SB@* with interval 10 seconds, taking 1 snapshots...

 -- Session Snapper v4.25 - by Tanel Poder ( https://blog.tanelpoder.com/snapper )


 ------------------------------------
  ActSes %Thread | WAIT_CLASS
 ------------------------------------
  4.25 (425%) | Cluster
  2.73 (273%) | Commit
  1.74 (174%) | ON CPU
  .15 (15%) | Other
  .04 (4%) | Concurrency
  .01 (1%) | Configuration

 -- End of ASH snap 1, end=2017-12-06 09:22:35, seconds=10, samples_taken=80, AAS=8.9
To summarize this test run: The benchmark levelled off at about 5000 TPS, the 12 user sessions were evenly spread across the two nodes and the main wait class was CLUSTER.
Re-run the same test on singleton service
Now let's change the configuration of the service to only be active on one instance. It would still fail over to the other node if that primary node crashed but all new connection requests will get redirected only to the instance running in orcl1. After the change, verify that only one instance is active for this service in the active listener config. See the difference between the SB and the PDB1 or "test" services below:[oracle@cluster1 ~]$ srvctl modify service -db orcl -service sb -modifyconfig -preferred orcl1 -available orcl2
[oracle@cluster1 ~]$
[oracle@cluster1 ~]$ lsnrctl status
LSNRCTL for Linux: Version 12.1.0.2.0 - Production on 06-DEC-2017 09:35:09
Copyright (c) 1991, 2014, Oracle. All rights reserved.
Connecting to (ADDRESS=(PROTOCOL=tcp)(HOST=)(PORT=1521))
STATUS of the LISTENER
------------------------
Alias LISTENER_SCAN1
Version TNSLSNR for Linux: Version 12.1.0.2.0 - Production
Start Date 06-DEC-2017 04:12:23
Uptime 0 days 5 hr. 22 min. 46 sec
Trace Level off
Security ON: Local OS Authentication
SNMP OFF
Listener Parameter File /u01/app/12.1.0.2/grid/network/admin/listener.ora
Listener Log File /u01/app/grid/diag/tns/cl1/listener_scan1/alert/log.xml
Listening Endpoints Summary...
(DESCRIPTION=(ADDRESS=(PROTOCOL=ipc)(KEY=LISTENER_SCAN1)))
(DESCRIPTION=(ADDRESS=(PROTOCOL=tcp)(HOST=10.31.42.42)(PORT=1521)))
Services Summary...
Service "orcl.a42.oraclecloud.internal" has 2 instance(s).
Instance "orcl1", status READY, has 2 handler(s) for this service...
Instance "orcl2", status READY, has 1 handler(s) for this service...
Service "pdb1.a42.oraclecloud.internal" has 2 instance(s).
Instance "orcl1", status READY, has 2 handler(s) for this service...
Instance "orcl2", status READY, has 1 handler(s) for this service...
Service "sb.a42.oraclecloud.internal" has 1 instance(s).
Instance "orcl1", status READY, has 2 handler(s) for this service...
Service "test.a42.oraclecloud.internal" has 2 instance(s).
Instance "orcl1", status READY, has 2 handler(s) for this service...
Instance "orcl2", status READY, has 1 handler(s) for this service...
The command completed successfully
Now we are ready to re-run the benchmark. Let's first verify that indeed all connections are made to only one node:
SQL> select inst_id, count(*) from gv$session where username = 'SB' group by inst_id;

  INST_ID COUNT(*)
 ---------- ----------
 1  12
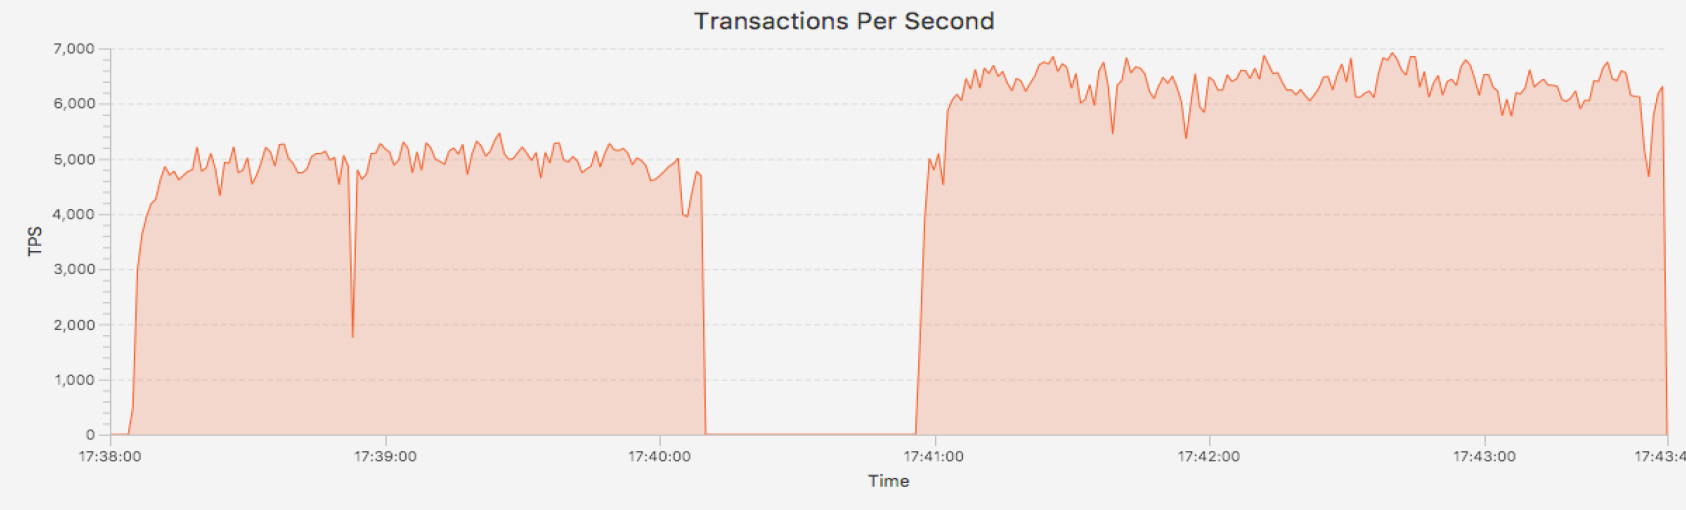
And the result is that this time, even though only one of the two nodes is used for the benchmark, the overall throughput is about 25% higher while one of the nodes completely idle. And if the numbers are not enough, there is also a visualization of the TPS throughput.
[oracle@cluster1 bin]$ ./charbench -v -c ../configs/Stress_Test.xml
 Author : Dominic Giles
 Version : 2.6.0.1046

 Results will be written to results.xml.
 Hit Return to Terminate Run...

 Time Users TPM TPS

 9:40:50 AM 0 0 0
 9:41:00 AM 12 15536 4794
 9:41:10 AM 12 74938 6282
 9:41:20 AM 12 139588 6220
 9:41:30 AM 12 205721 6278
 9:41:40 AM 12 268106 6332
 9:41:50 AM 12 332876 6477
 9:42:00 AM 12 378663 6481
 9:42:10 AM 12 383823 6642
 9:42:20 AM 12 383594 6257
 9:42:30 AM 12 380948 6390
 9:42:40 AM 12 383238 6923
 9:42:50 AM 12 383988 6509
 9:43:00 AM 12 387262 6522
 9:43:10 AM 12 384656 6612
Snapper confirms that all Cluster related waits have disappeared and the throughput now only seems to be limited by how fast we can commit.
SQL> @snapper ash=WAIT_CLASS 10 1 user=SB@*
 Sampling SID user=SB@* with interval 10 seconds, taking 1 snapshots...

 -- Session Snapper v4.25 - by Tanel Poder ( https://blog.tanelpoder.com/snapper )


 ------------------------------------
  ActSes %Thread | WAIT_CLASS
 ------------------------------------
  5.20 (520%) | Commit
  1.87 (187%) | ON CPU
  .22 (22%) | Other
  .06 (6%) | Concurrency
  .01 (1%) | Network

 -- End of ASH snap 1, end=2017-12-06 09:42:25, seconds=10, samples_taken=79, AAS=7.4
GC or Cluster waits from same-block updates
I showed how running the same workload can be more efficient if only one instead of many nodes is used. But why is that? The answer lies in how cache fusion works with dirty blocks. While RAC is great at fetching clean (unmodified) blocks from another instance over the interconnect, dirty blocks that have had DML applied are a different story. There is actually a lot that the sending instance has to do. It creates a copy of the dirty block called a Past Image (PI) and has to write the associated redo to disk before sending the block over the interconnect. That requires significant CPU and IO resources and does not depend on the latency or bandwidth of the interconnect. The benchmark is configured to perform a significant amount of DML on a rather small table of 64MB and 100k rows with 12 sessions performing the same operations concurrently. As a result chances are high that one session will update a row in the same block that another session just modified. And with the evenly distributed, default load-balancing behaviour that means those dirty blocks get bounced back and forth between the instances.Conclusion
Workloads that happen to update the same datablocks from sessions on different nodes can suffer from this "RAC tax" and you can see that in GC or Cluster related waits. One way to avoid this is to use a singleton service that directs all new connections for a given application to only one node at a time. Hence my general recommendation is to create a new service for each application or type of workload. Then you can observe if this becomes a problem and modify the service to a singleton. This has been one of the more valuable tricks in my toolbox and a discussion I have had with many architects and developers who think that more is always better.Other posts in this series
- Oracle Service Secrets: Group and Filter
- Oracle Service Secrets: quiesce tactically
- Oracle Service Secrets: Migrate Transparently
Oracle Database Consulting Services
Ready to optimize your Oracle Database for the future?
On this page
Share this
Share this
Fixing Windows RAC listener to listen on IP address of Hostname
![]()
Fixing Windows RAC listener to listen on IP address of Hostname
Sep 3, 2014 12:00:00 AM
2
min read
Oracle Silent Mode, Part 8: Add a Node to a 11.1 RAC Database
![]()
Oracle Silent Mode, Part 8: Add a Node to a 11.1 RAC Database
Aug 27, 2008 12:00:00 AM
4
min read
How to Test Data Guard Fast-Start Failover by Shutting Down Standby Server
![]()
How to Test Data Guard Fast-Start Failover by Shutting Down Standby Server
Jan 22, 2020 12:00:00 AM
6
min read