1. Overview
Despite the fact that Apache Cassandra provides a large number of metrics through the popular Metrics library, it does not, however, provide any out-of-the-package solutions to monitor these metrics. The command-line based nodetool utility can be used to analyze some of the Cassandra internal metrics, but it is by the nature not designed for monitoring purpose. For many users, DataStax OpsCenter becomes the only viable and ready-to-use monitoring solution for them to monitor their Cassandra clusters. The bad news, though, is that starting from OpsCenter v6.0, OpsCenter will be only available to DataStax Enterprise Edition (DSE) users. Open source Cassandra users cannot use this tool any more. In this post, I will explore an open source Cassandra monitoring solution based on Cassandra pluggable metrics reporting with Graphite and Grafana. The post will start with the high level architecture of this solution, followed by the step-by-step instructions of setting this solution up on a Ubuntu 14.0.4 VM based host. The Cassandra version used in this setup is 2.1.14.2. Architecture Overview
The diagram below describes a high level, logical view of the proposed solution. The main components of this solution are as follows and I'll go through each of them with more details in later sections.- Cassandra cluster (with Metrics-Graphite reporter enabled): source of monitoring metrics
- Graphite server: receiver and aggregator of Cassandra metrics
- Grafana server: metrics dashboard provider
- Apache web server: web host for metrics dashborad
- Postgres SQL database server: storage provider of received metrics and dashboard metadata
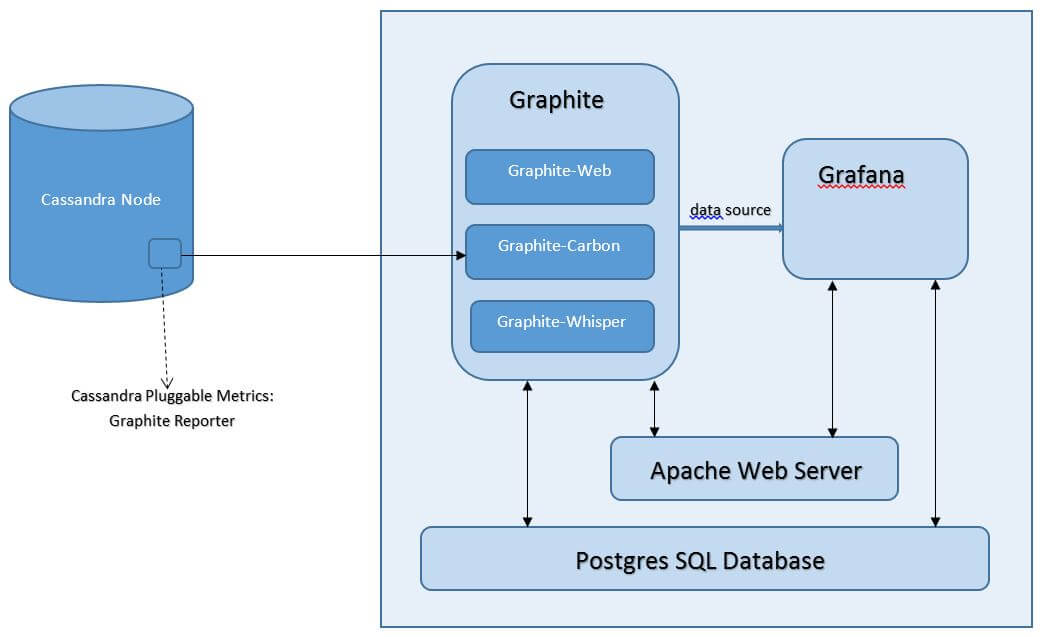
Please note that for simplicity purpose the diagram only shows one Cassandra node, but the idea here can be extended to a Cassandra cluster. Basically the concept behind is that each node within a Cassandra cluster sends Cassandra internal metrics to a central Graphite server (in particular Graphite-carbon sub-component). The metrics are stored, aggregated by Graphite and then displayed via Grafana (a web-based dashboard solution). Please also note that the web server and database server in the diagram are not necessarily limited to only Apache web server and Postgres SQL database server. Other web servers and database servers that are supported by Graphite can also be used.
3. Configure Cassandra with Graphite metrics reporter
Since Cassandra version 2.0.2, Cassandra has provided the built-in feature of Pluggable Metrics Reporting that can expose internal Cassandra metrics on the fly to different metrics reporters such as CSV, console, Graphite, Gangalia, and so on. In this solution, we use the Graphite reporter. Having said so, the solution discussed in this post requires Cassandra version at least 2.0.2. For earlier version like 1.2, a customized metrics collection agent need to be deployed on Cassandra node to collect Cassandra JMX metrics and send it to the target Graphite server. In order to configure Cassandra service to work with graphite metrics reporter, the following steps are required: 1). Download Graphite metrics reporter jar file (metrics-graphite-2.2.0.jar) from here 2). Put the downloaded jar file in Cassandra library folder, e.g. /usr/share/cassandra/lib/ (the default Cassandra library folder under packaged installation on Ubuntu 14.0.4) 3). Create a metrics reporter configuration file (e.g. metrics_reporter_graphite.yaml) and put it under the same folder as cassandra.yaml file, e.g. /etc/cassandra/ (the default Cassandra configuration folder under packaged installation on Ubuntu 14.0.4). [code language="bash"] graphite: - period: 30 timeunit: 'SECONDS' prefix: 'cassandra-clustername-node1' hosts: - host: 'localhost' port: 2003 predicate: color: 'white' useQualifiedName: true patterns: - '^org.apache.cassandra.+' - '^jvm.+' [/code] 4). Modify cassandra-env.sh file to include the following JVM option: [code language="bash"] METRICS_REPORTER_CFG="metrics_reporter_graphite.yaml" JVM_OPTS="$JVM_OPTS -Dcassandra.metricsReporterConfigFile=$METRICS_REPORTER_CFG" [/code] 5). Restart Cassandra service The meaning of of the Graphite metrics reporter configuration file contents is quite straightforward and self-explanatory. Some key contents are:- "period" and "timeunit" together determines how frequently the metrics are sent out to the target receiver/sink (Graphite server for our case)
- "prefix" can be thought of as a source metric identifier. This is because Graphite is a generic monitoring framework which can receive metrics from different sources. It is therefore a good practice to provide the prefix string with a clear naming pattern. For example, a good pattern for Cassandra monitoring can be something like: 'cassandra-cluster.name-node.IP/name'. Once we do so, we can easily identify Cassandra metrics on Graphite/Grafana side for a particular node within a particular cluster.
- "hosts" part defines the target Graphite host name/IP and port number (default 2003 if not otherwise changed)
- "predicate.useQualifiedName" specifies whether or not the fully qualified metrics names are used (e.g. org.apache.cassandra.metrics.Compaction.pendingTasks).
- "predicate.patterns" defines the metrics filter, meaning only those metrics with the names matching the specified pattern are sent out to the target receiver/sink.
4. Graphite Monitoring Framework
The core part of the solution is based on the generic Graphite monitoring framework which is designed to store, aggregate, and render time-series data. It is a widely used framework and the detail description of it is beyond the scope of this post. In this section, I will briefly touch upon the high level structure of the framework and how our solution fits into this framework. There are three major components within the core Graphite monitoring framework:- Graphite-carbon is an event-driven networking engine that listens for time-series data
- Graphite-whisper is a simple storage library to store time-series data
- Graphite-web is a web application that is built upon Python Django web framework and uses Cairo 2D graphics library to render time-series data on demand.
- Postgres SQL database to replace the default embedded SQLite database as the metrics store. It is also used to store Grafana dashboard metadata.
- Grafana to replace the default "Graphite-web" component for better metrics visualization, although "Graphite-web" is still available at a different port number (as the data source for Grafana)
5. Install and Configure Cassandra Monitoring Solution Software Components
In this section, we will go through the step-by-step instructions of installing and configuring various monitoring components, other than Cassandra part, of this solution on an Ubuntu 14.0.4 host. The configuration of Cassandra part is already described in Chapter 3.- Install and Configure Postgres SQL database server
- Install and Configure Graphite
- Install and Configure Grafana
- Install and Configure Apache Web Server
6. Display Cassandra Metrics via Grafana
At this point, if everything is working fine (e.g. no error in log files). Graphite should be already ready to receive the metrics sent from Cassandra node and display them through Graphite-web page. A sample screenshot is as below:
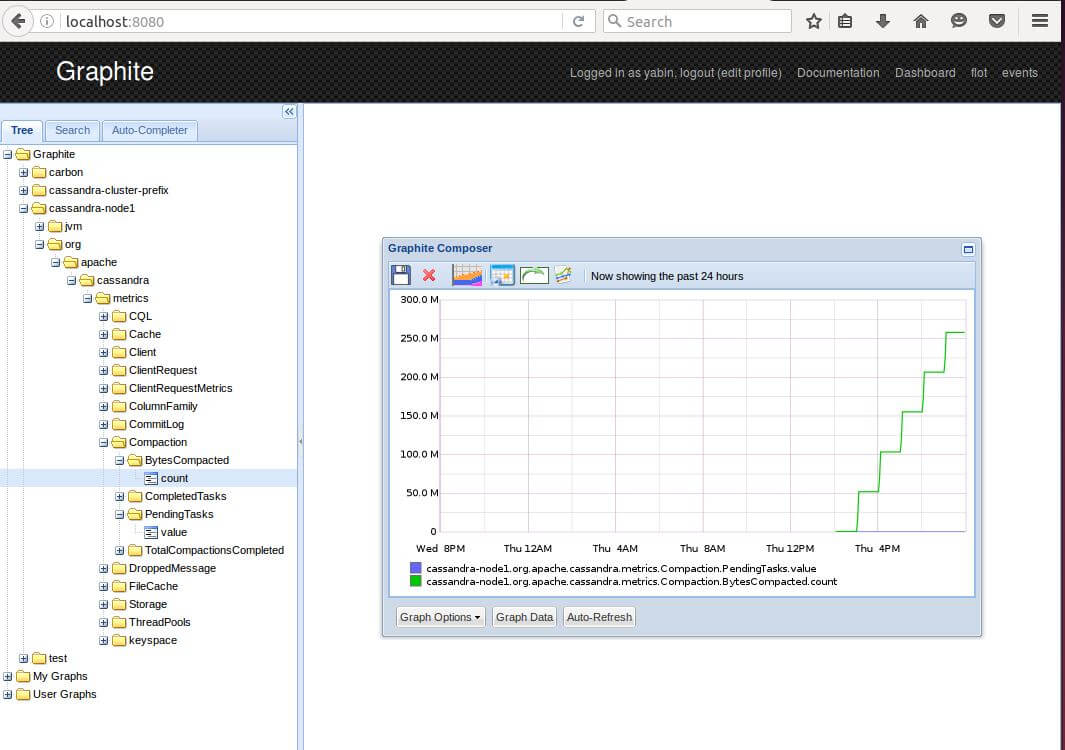
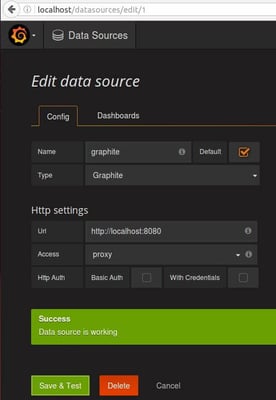
Graphite-web UI, although working, is far from being as a beautiful and more user friendly way to manage and display the Cassandra metrics through a web page. In order to gain the benefits offered by Grafana, we need to link Graphite and Grafana together, having Graphite as the feeding data source for Grafana. We can do so through Grafana web UI. The steps are as below: 1). Add Graphite as Grafana Data Source. Once the Graphite data source is added, click the "Save and Test" button to make sure it is working.
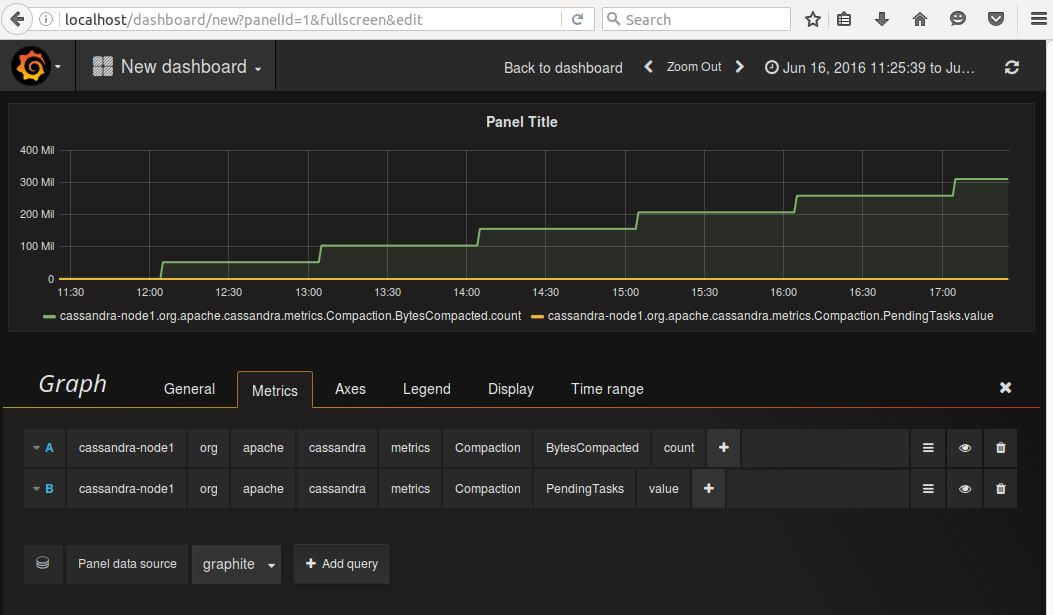
2). The next step is to add a dashboard, a graph, and display the desired metrics on the graph. The final graph looks like this:
7. Conclusion
In this post, I explored an alternative Cassandra monitoring solution to DataStax's OpsCenter. This solution is based purely on open-source-based software stacks. It is worthy to point out that this solution is not only designed for monitoring Cassandra metrics. Actually, from the architecture diagram above, Cassandra node is only acting as one type of metrics provider. Other types of metrics provider, such as StatsD, or CollectsD, can also be used to feed data into this solution, as long as it can trigger data event for Graphite-carbon. Please also note that the solution discussed in this post is far from being a complete Cassandra monitoring solution. It can be expanded further to include other types of metrics such as 1) OS/hardware level metrics and 2) Application/Code level metrics into the picture to provide a holistic view of the application system.
Cassandra Database Consulting Services
Ready to optimize your Cassandra Database for the future?