Locally debug your serverless function
Tip If you'd like to follow along, clone this git repo https://github.com/rshurts/lambda-debug-example, follow the instructions in the README.md, and return to the blog.
Serverless framework
My go-to framework for creating Lambda functions is the Serverless Framework. Serverless manages the entire lifecycle of the Lambda and can even deploy required services using Cloud Formation. Check it out if you are looking to build your own serverless application. Here we're going to take advantage of the fact that the Serverless Framework can invoke functions locally. And use that invocation to setup local debugging. Use the following command, where -f identifies the function name and -p is the path to the request payload:sls invoke local -f findCharactersByTag -p examples/findCharactersByTag.jsonNormally when a Lambda runs it assumes an IAM role. However, when Serverless invokes the function locally it uses your default AWS profile. Meaning it isn't an exact simulation of AWS. Read more about the difference in the Serverless docs.
Visual Studio Code and serverless
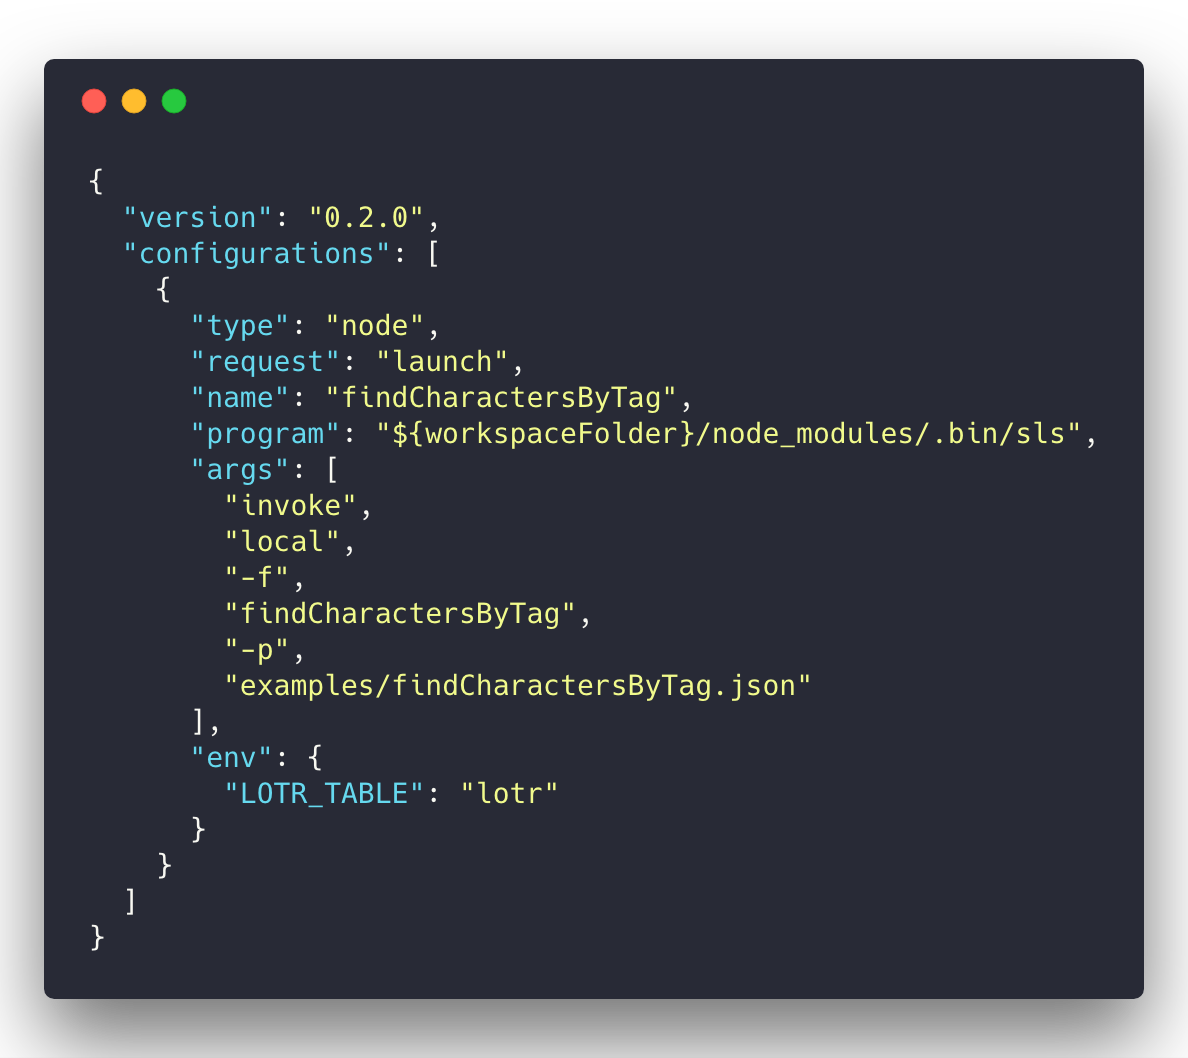
Visual Studio Code manages debugging through launch configurations. Open the Debug panel and create a new Node.js launch configuration. Add the following to the launch.json: To begin debugging, set some breakpoints and perform the following steps:
- Select findCharacterByTag from the configurations select box.
- Click the Start Debugging button.
- Use the debugger buttons to step through the breakpoints.
Tip You need one launch configuration per function. Add a new node launch object for each function and update the name, args and environment variables.
Webstorm and serverless
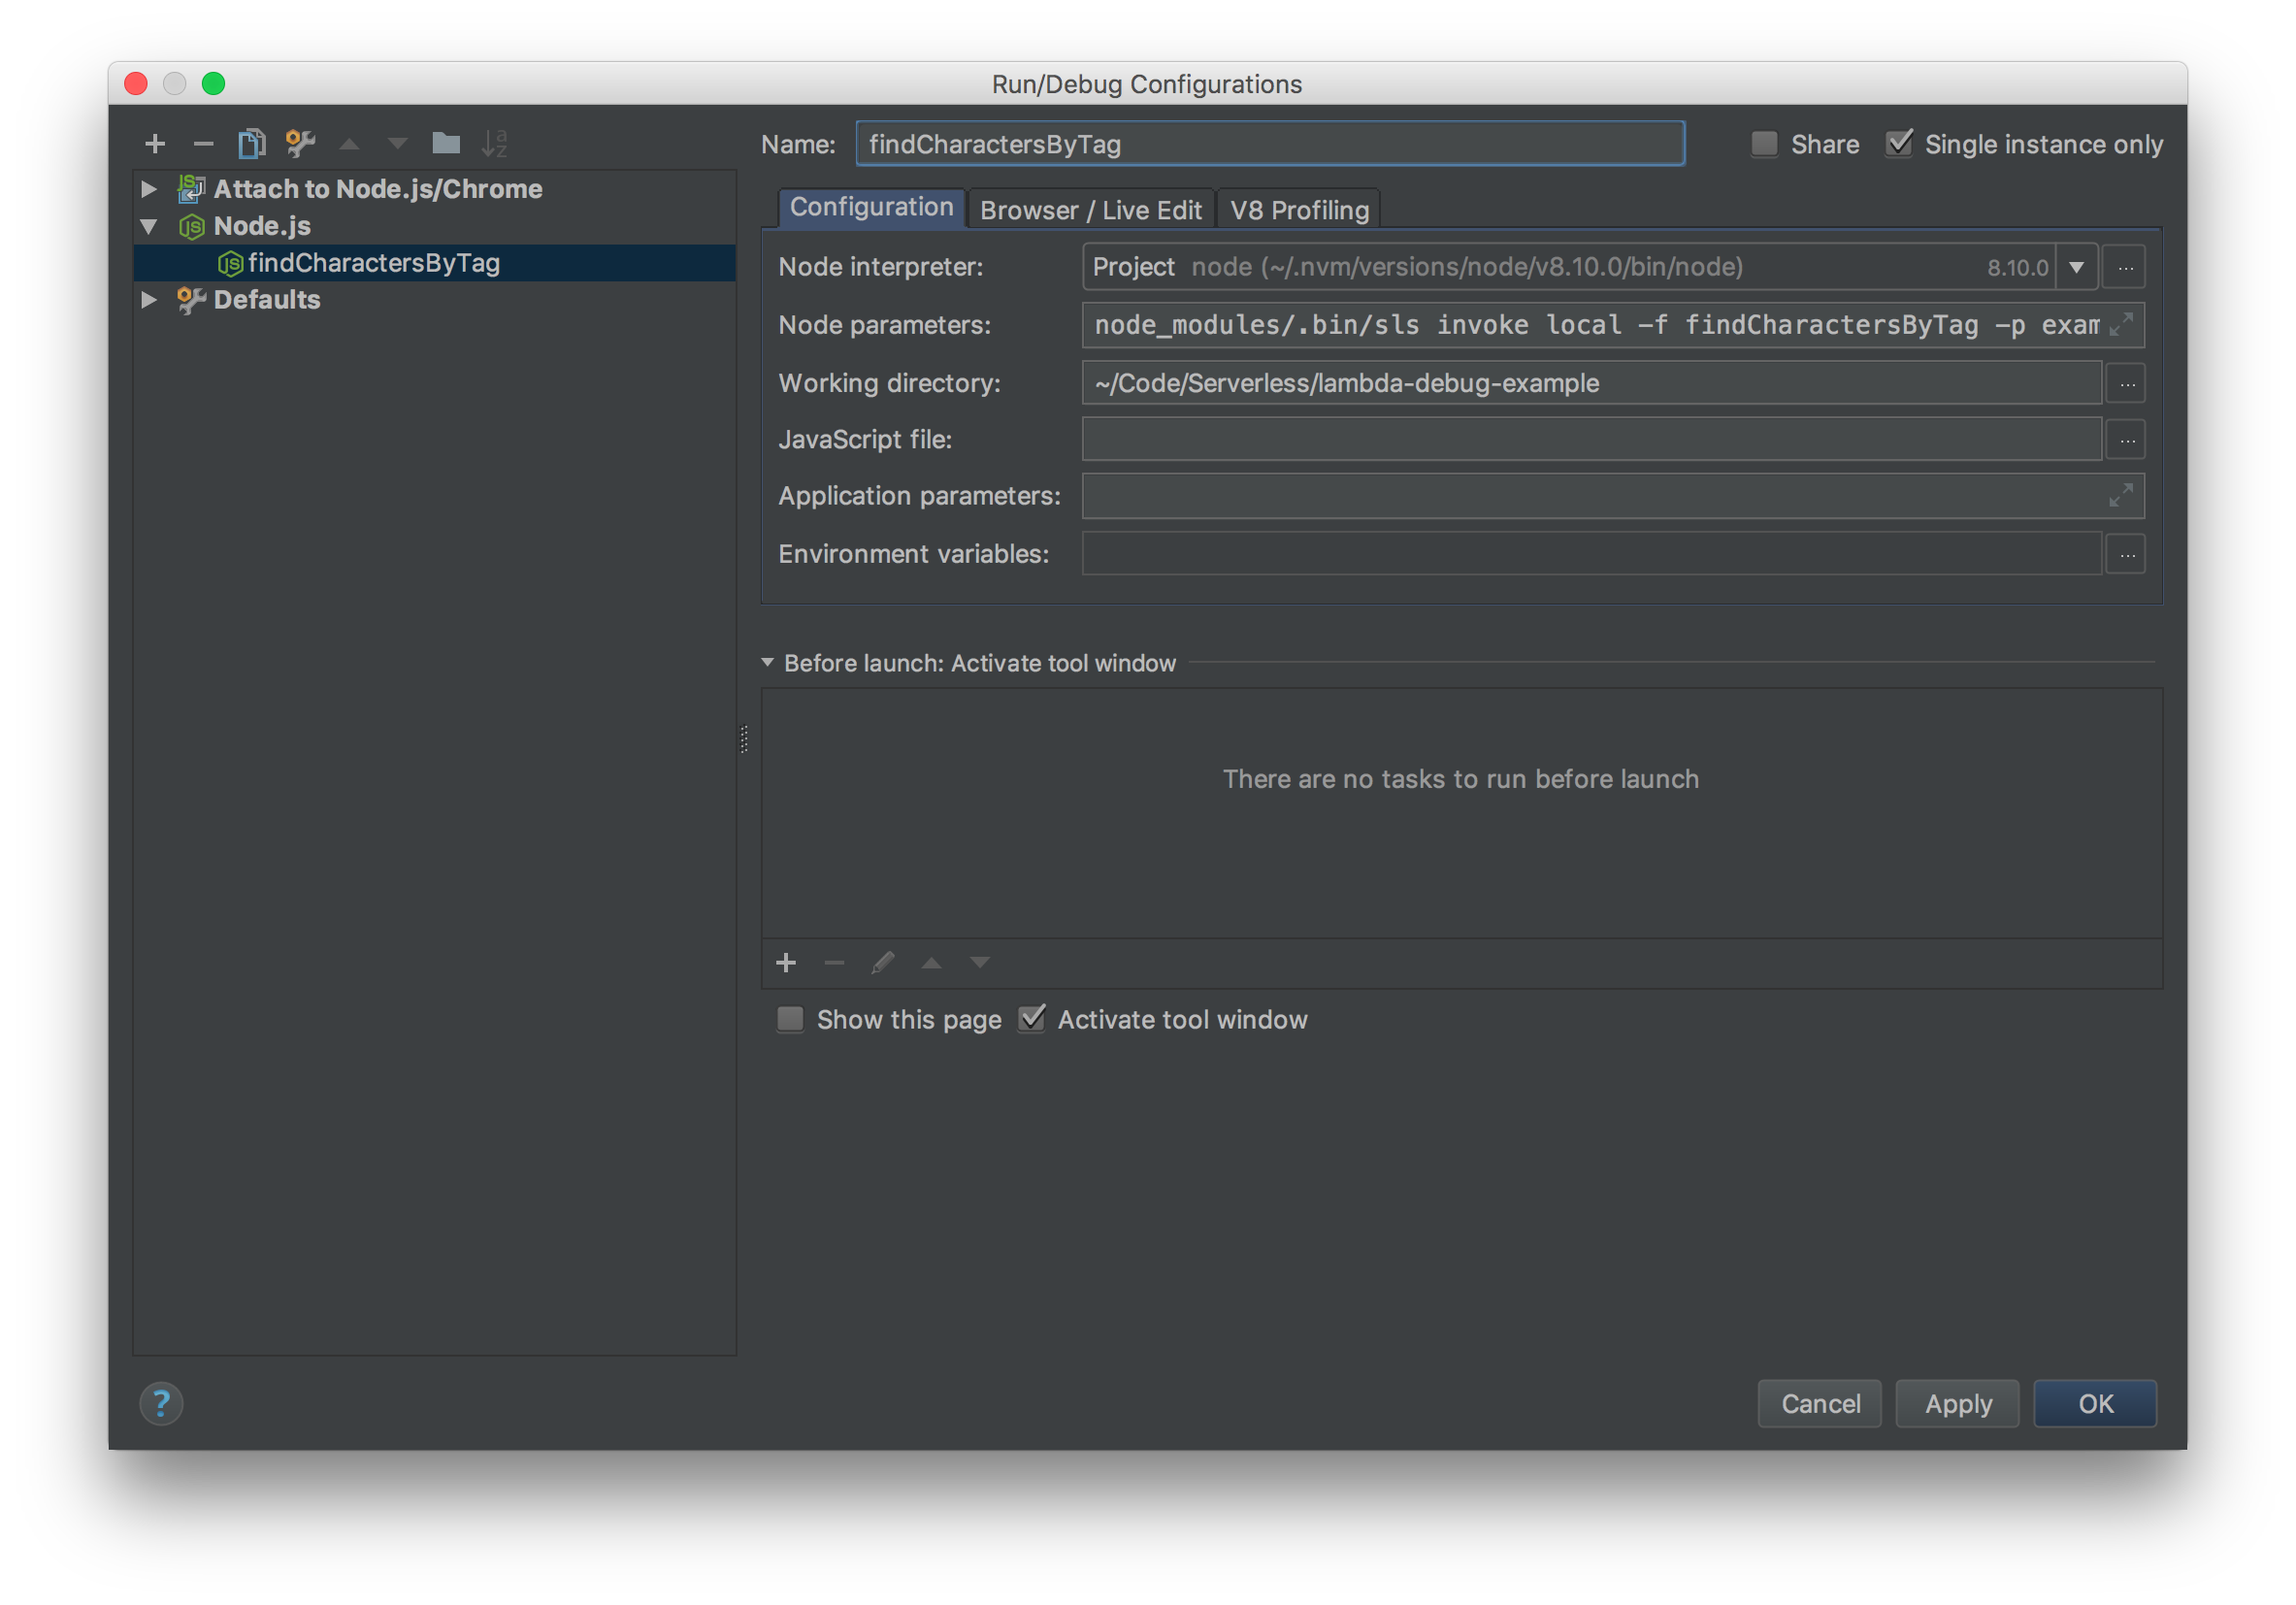
- Create a Node.js configuration and name it _findCharactersByTag_.
- In Node parameters: enter node_modules/.bin/sls invoke local -f findCharactersByTag -p examples/findCharactersByTag.json.
- Select findCharactersByTag from the configurations select box.
- Click the Debug button.
- Use the debugger buttons to step through the breakpoints.

AWS SAM Local
Another option for executing Lamdba's locally is AWS SAM Local. Introduced prior to the 2017 re:Invent, SAM Local built upon the AWS Serverless Application Model (SAM) and is currently in beta. SAM Local is a CLI tool installed via NPM and requires docker installed and running. SAM requires a template.yml to understand how to run your function. I used Serverless SAM to convert my serverless.yml into a template.yml, but you can also follow the samples in the AWS SAM Local repo to create a template from scratch. To run SAM Local with debugging execute the following command, where -e is the path to the example request and -d is the debug port.sam local invoke -e examples/findCharactersByTag.json -d 9229Make sure to detach your debugger to send the result back to SAM Local.
Visual Studio Code and SAM Local
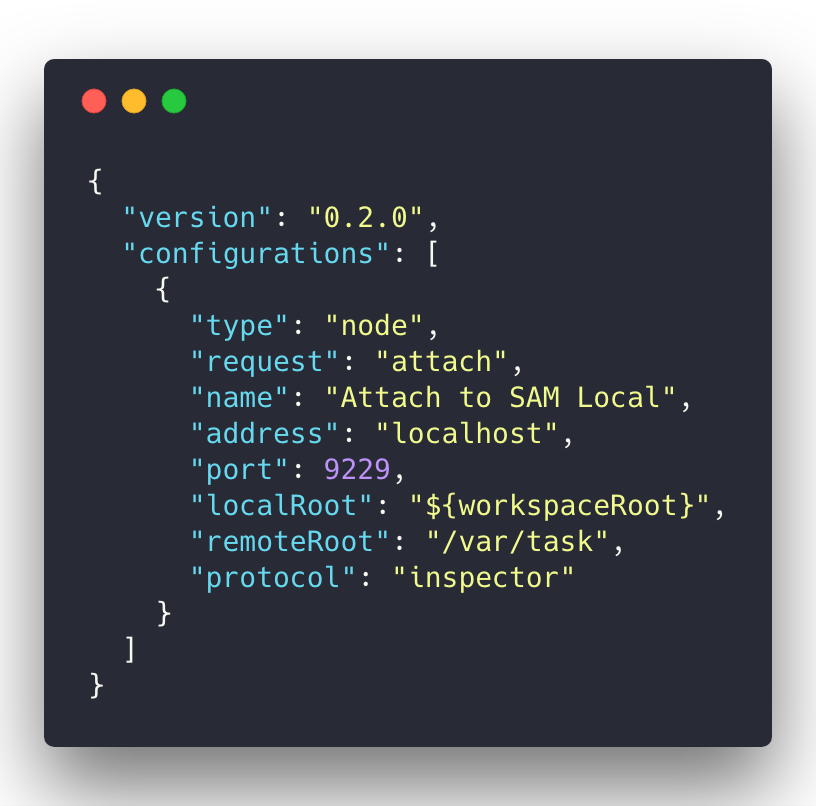
Open the Debug panel and create a new Node.js launch configuration and add the following to the launch.json: To begin debugging, set some breakpoints and perform the following steps:
- In a terminal run sam local invoke -e examples/findCharactersByTag.json -d 9229.
- Select Attach to SAM Local from the configurations select box.
- Click the Start Debugging button.
- Use the debugger buttons to step through the breakpoints.
- Detach the debugger to see the results returned to SAM Local.
Webstorm and SAM Local
- In a terminal run sam local invoke -e examples/findCharactersByTag.json -d 9229.
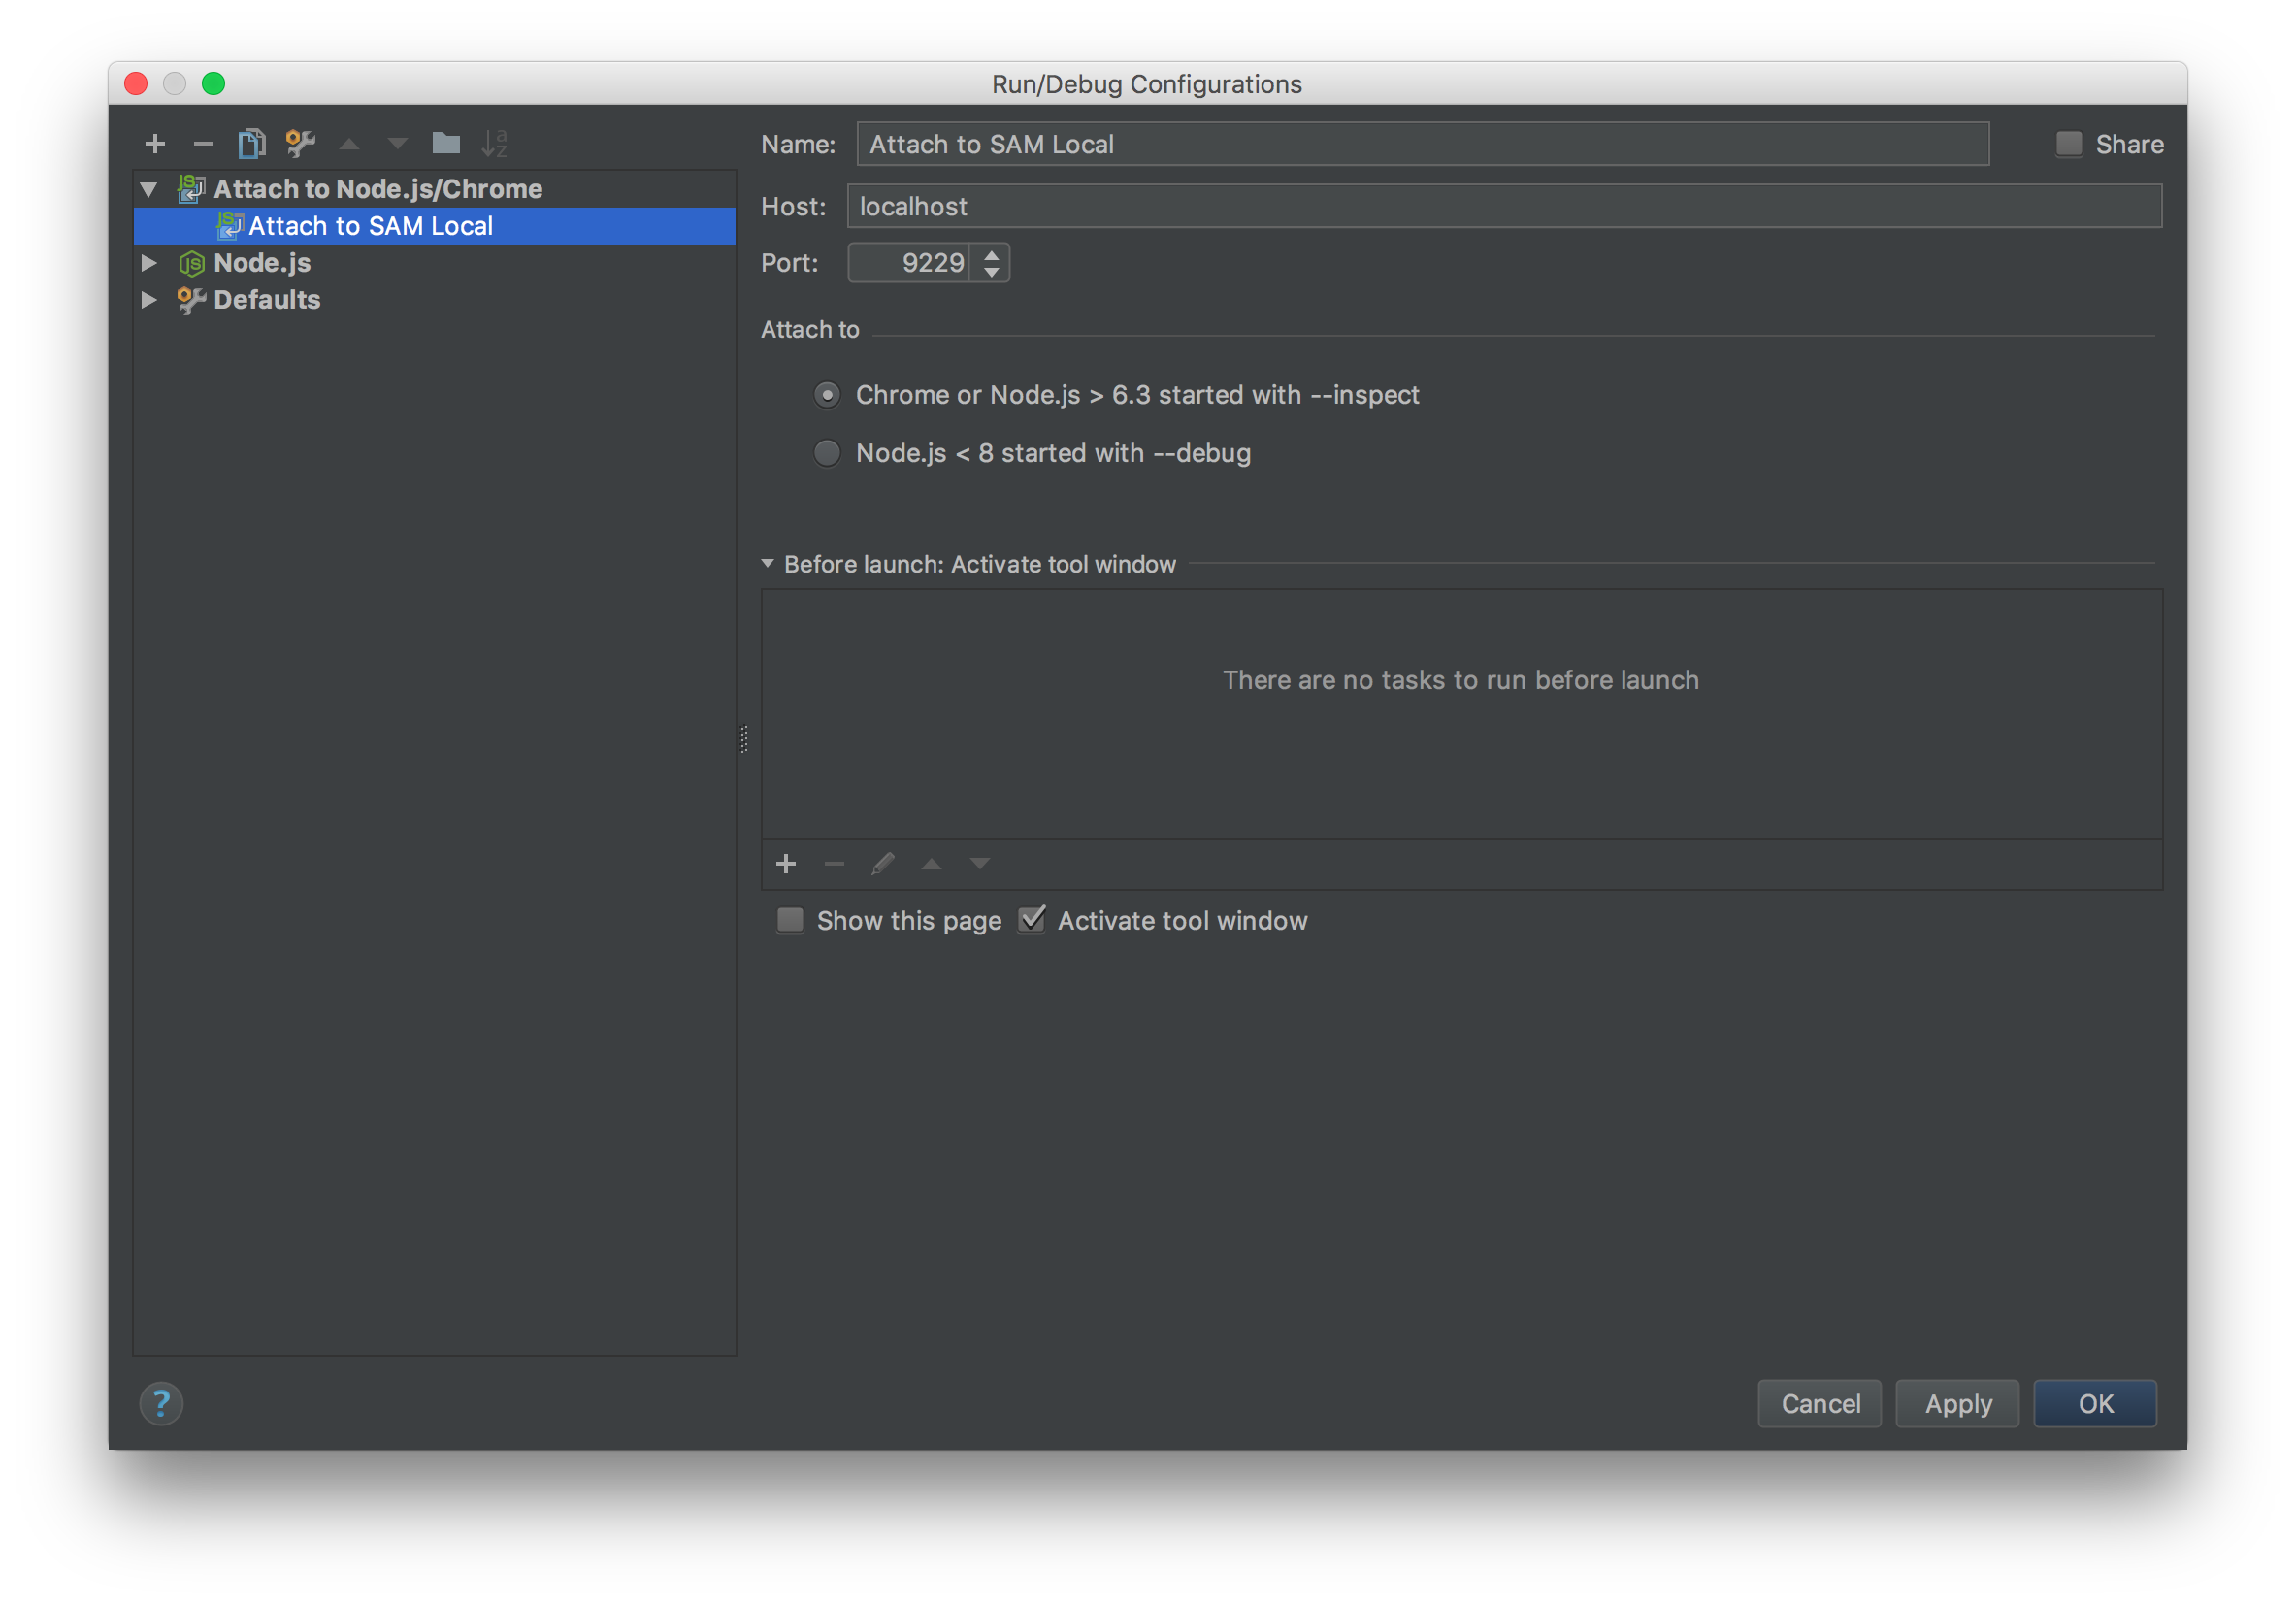
- Create an Attach to Node.js/Chrome configuration and name it Attach to SAM Local.
- Make sure the port in the configurations matches used in the command line -d parameter.
- Select Attach to SAM Local from the configurations select box.
- Click the Debug button.
- Use the debugger buttons to step through the breakpoints.
- Detach the debugger to see the results returned to SAM Local.
 You are now equipped with two methods of debugging Lambdas while still using managed services like DynamoDB. Go confidently write your next serverless application!
On this page
Share this
Share this
More resources
Learn more about Pythian by reading the following blogs and articles.
Azure Platform and Network Infrastructure Security fundamentals
![]()
Azure Platform and Network Infrastructure Security fundamentals
Jan 2, 2020 12:00:00 AM
5
min read
Explaining Azure Data Factory Mapping Data Flows – SQL On The Edge Episode 20


Explaining Azure Data Factory Mapping Data Flows – SQL On The Edge Episode 20
Jun 18, 2019 12:00:00 AM
2
min read
Analytics with Limitless Scale on Microsoft Azure - Part 1
![]()
Analytics with Limitless Scale on Microsoft Azure - Part 1
Dec 17, 2019 12:00:00 AM
3
min read
Ready to unlock value from your data?
With Pythian, you can accomplish your data transformation goals and more.
