


When an Oracle database throws an ORA-04031 error, it’s easy to get bogged down in memory management. But what happens when standard tuning tricks don't solve the underlying problem?
In this post, I’ll detail the steps I took to identify the activity triggering sudden ORA-04031 errors. The goal here is not to elaborate on troubleshooting the error itself, but rather to show how clues from various sources steered the course of the investigation until the root cause was found.
1. Environment and issue description
An Oracle 19.24 database (RAC One Node) was generating the following error:

Attempting to flush the shared pool did not resolve it. Luckily, because the sga_target initialization parameter was set lower than sga_max_size, I was able to increase it by a few gigabytes without an instance restart.
This provided immediate relief, as sessions resumed normal operations and stopped receiving the ORA-04031 error. But more importantly, it also bought me some additional time to investigate what caused the issue.
2. Diagnosing shared pool fragmentation
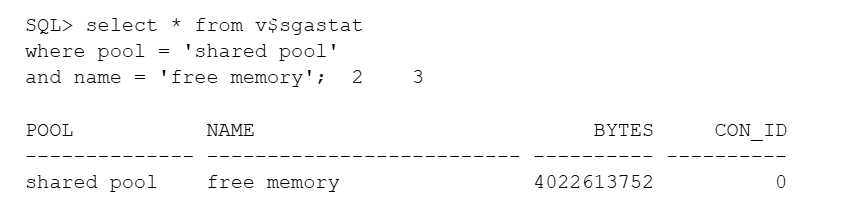
A quick initial check suggested shared pool fragmentation. Despite having plenty of free memory available, allocations as small as 40 bytes were failing with ORA-04031:
As Tanel Poder explains in this post on shared pool subpool utilization:
"There is no big enough free chunk available even after flushing out unpinned chunks from LRU list. In other words, you have a lot of small free chunks scattered around in different places in the shared pool, but there is no single big enough chunk available for accommodating our allocation."
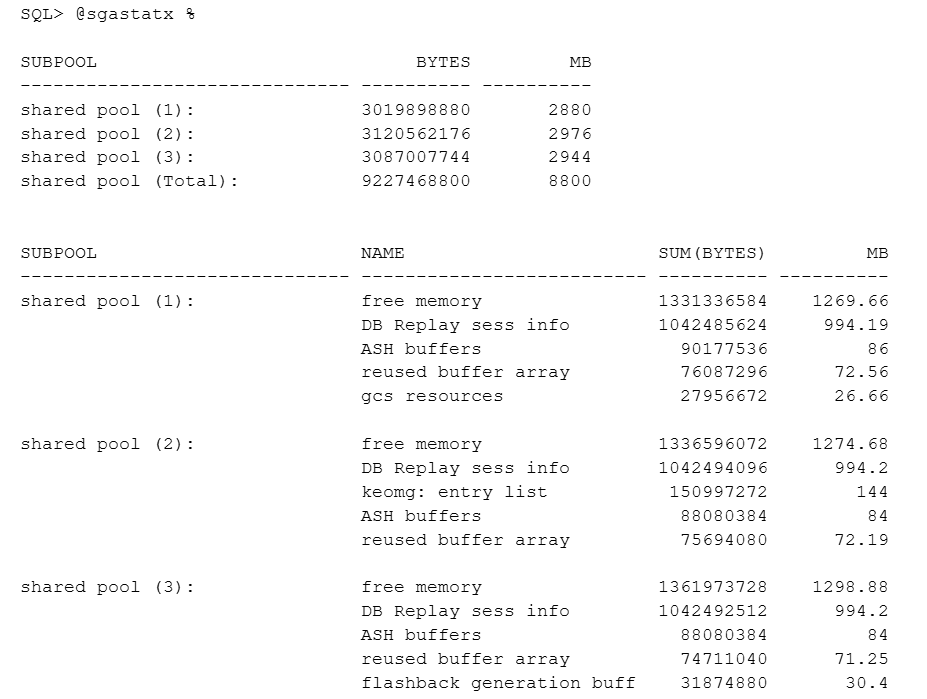
Checking for unbalanced subpool usage (as suggested in Tanel's article) revealed no apparent issues:
-- All allocations:
3. Inspecting dynamic SGA operations
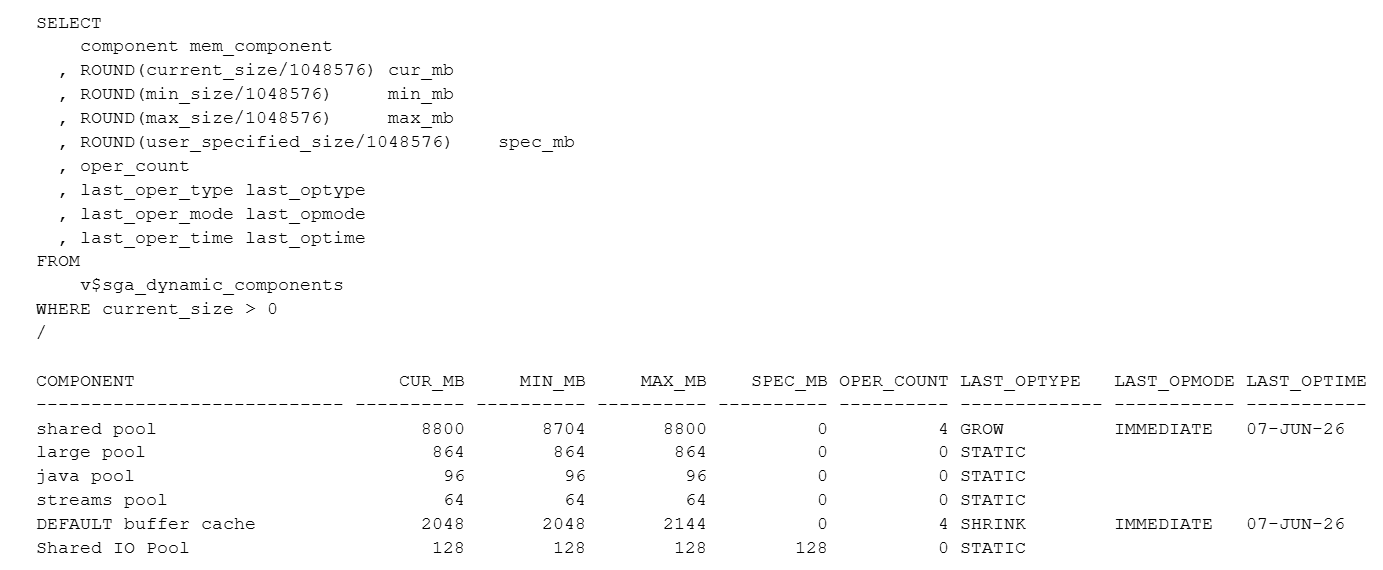
Next, I checked the instance memory usage breakdown from v$sga_dynamic_components. The LAST_OPER_TYPE column revealed that the latest operation was an increase of the shared pool’s size and a decrease of the buffer cache:
Querying v$sga_resize_ops revealed the dynamics and timings of the shared pool and buffer cache resize events:

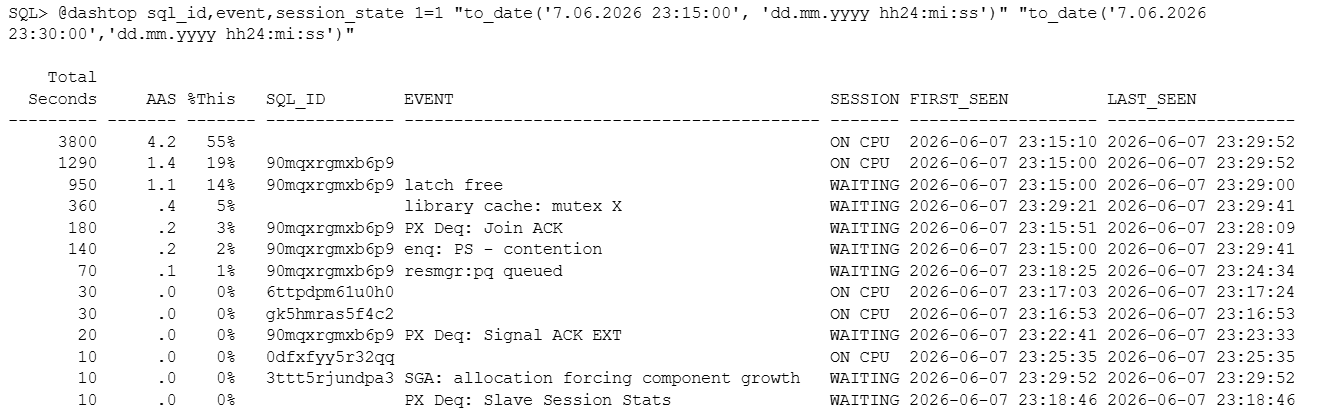
Because the shared pool growth operation failed on 07-JUN-2026 at 23:19, my next step was to investigate database activity around that specific timestamp. Aside from 4.2 sessions executing on CPU, the statement with SQL_ID 90mqxrgmxb6p9 was the most active:
4. Pivoting to AWR metrics
Up to this point, the investigation had been narrowly focused on memory allocation analysis. To gain a perspective on database activity from a different angle, I generated an AWR report for the hour leading up to the error.
The 'Load Profile' section immediately highlighted a possible issue, showing an unexpectedly high value for the "Logons" metric:
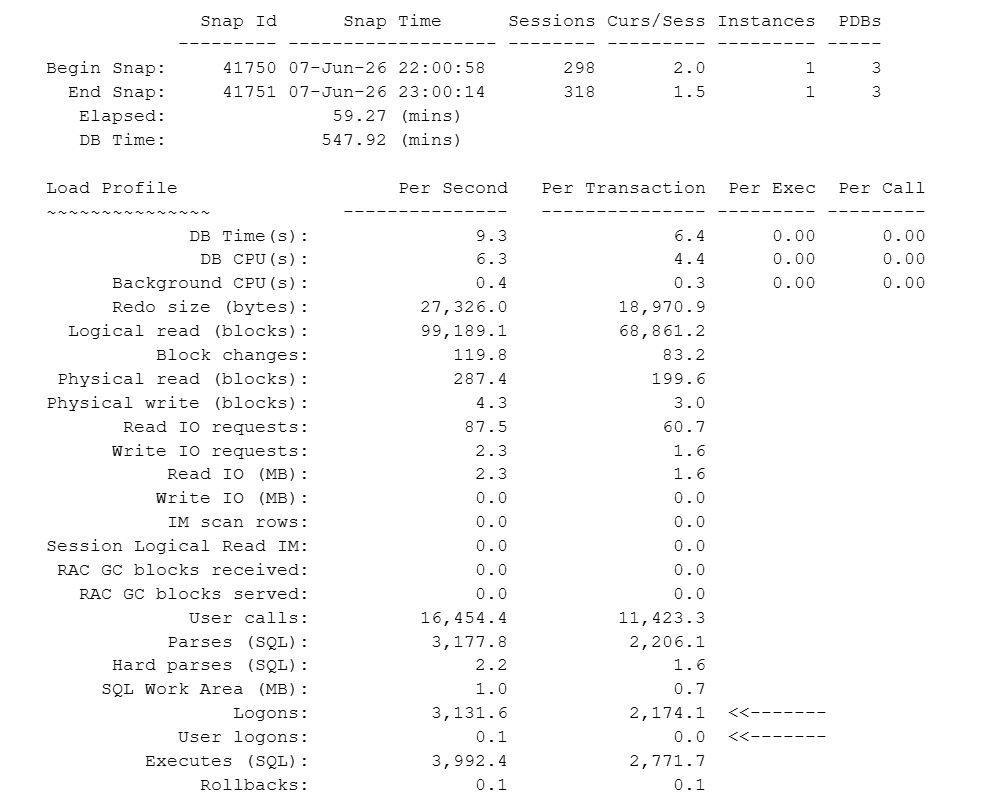
What's the difference between the reported "Logons" and "User logons" metric?
"Logons" includes:
- External connections: real client connections, usually established over the listener
- Database internal connections:
- system background processes, for example, Job queue processes calls
- parallel execution (PX) servers logons
- recursive sessions (internal administrative sessions)
"User logons" is a subset of "Logons", as it only includes real client/application connections, excluding parallel execution servers and internal recursive background processes.
The high "Logons" statistic combined with a low "User logons" value meant the database was doing a lot of internal work, rather than handling new connections from external users. This finding steered the investigation toward checking parallel execution and job activity metrics.
Sure enough, the Instance Activity Stats section of the 1-hour AWR report confirmed significant parallel activity:
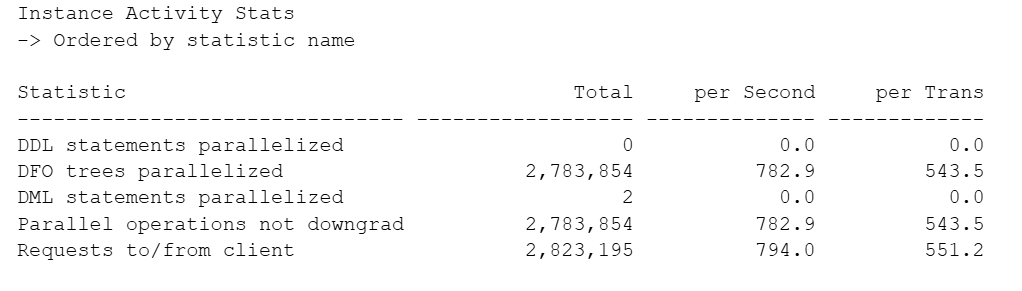
The reported number of distinct parallel executions is unusually high. Parallel queries are typically reserved for "heavy-duty" operations on large datasets, which take longer to run. As explained by Oracle's docs there are scenarios where implementing parallelism is not a good choice, and a high-concurrency environment is one of them.
5. Unmasking the culprit SQL
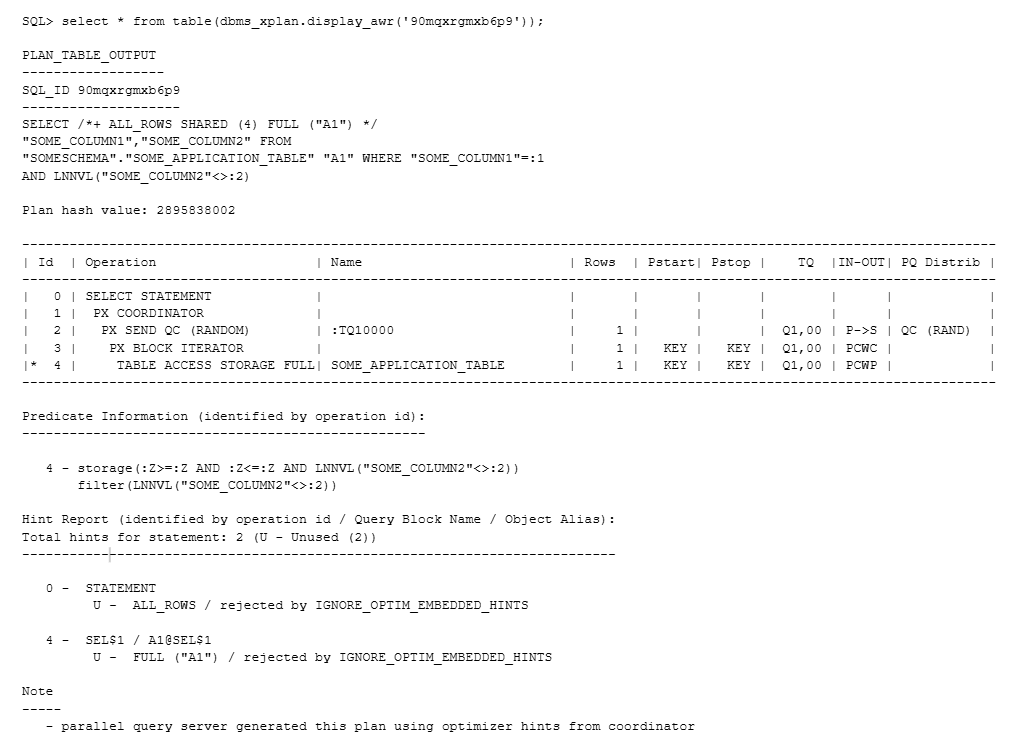
Returning to our analysis of SQL_ID=90mqxrgmxb6p9, this specific query was running in parallel, and interestingly, it included the SHARED hint, which is an alias for the PARALLEL hint:
Querying DBA_HIST_SQLSTAT revealed that the SQL was executed approximately 3 million times per hour, it processed no rows, and 4 PX servers were used per execution:
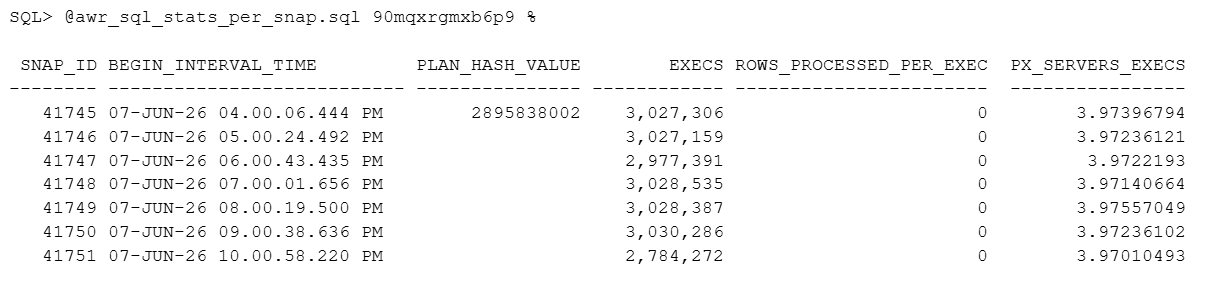
While high execution counts aren't necessarily a problem on their own, the reported counts are exceptionally high for a parallel query.
6. The root cause revealed
Now came the mystery: Who or what was running this query? The USERNAME, PROGRAM, and MACHINE columns in the DBA_HIST_ACTIVE_SESS_HISTORY view provided the answer. Interestingly, the connections were coming from the same server hosting the database experiencing the ORA-04031 errors (let's call it Database "A"):
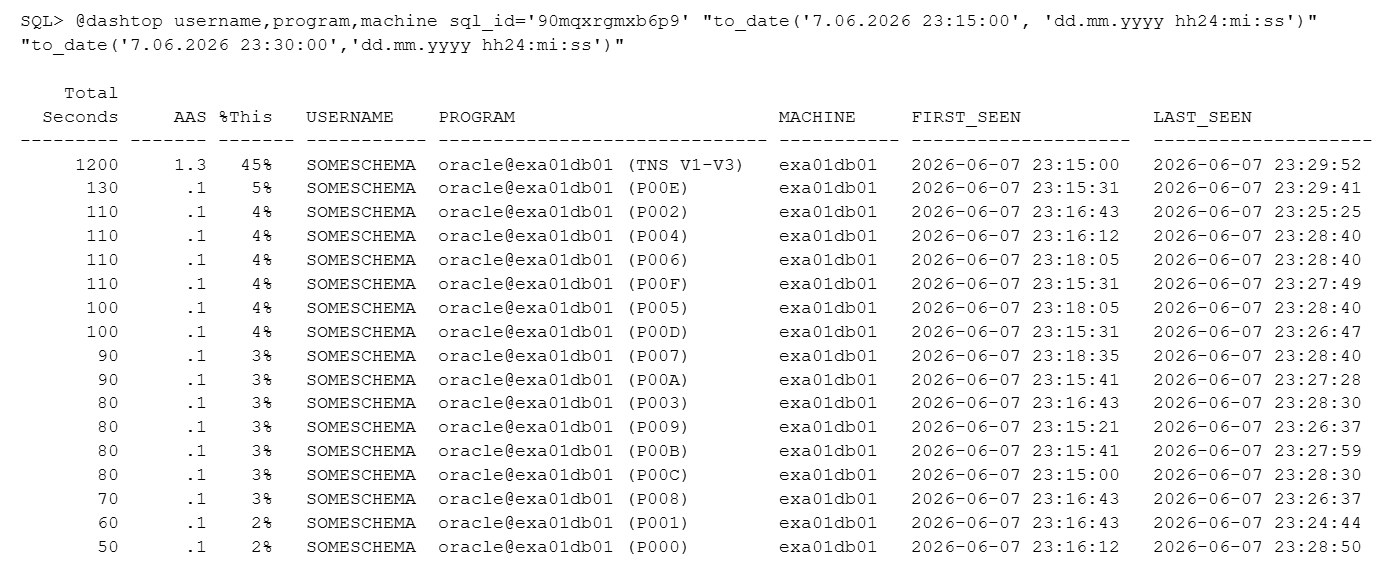
The value “oracle@exa01db01 (TNS V1-V3)” in the PROGRAM column indicates that the "client" initiating the connection is another Oracle Database instance running on the same server. Luckily, there was only one other database running on this node, and it was relatively easy to know where to look next.
The investigation thus continued in the database that appeared to be executing SQL_ID=90mqxrgmxb6p9 over a database link (let's call it Database "B"). Checking for activity around this exact timeframe, I found a query, SQL_ID 4wdzfjcupj06x, which was active and experiencing a very promising-looking wait event: "SQL*Net message from dblink":

Checking SQL_ID=4wdzfjcupj06x with plan hash 900329511 revealed the mystery:
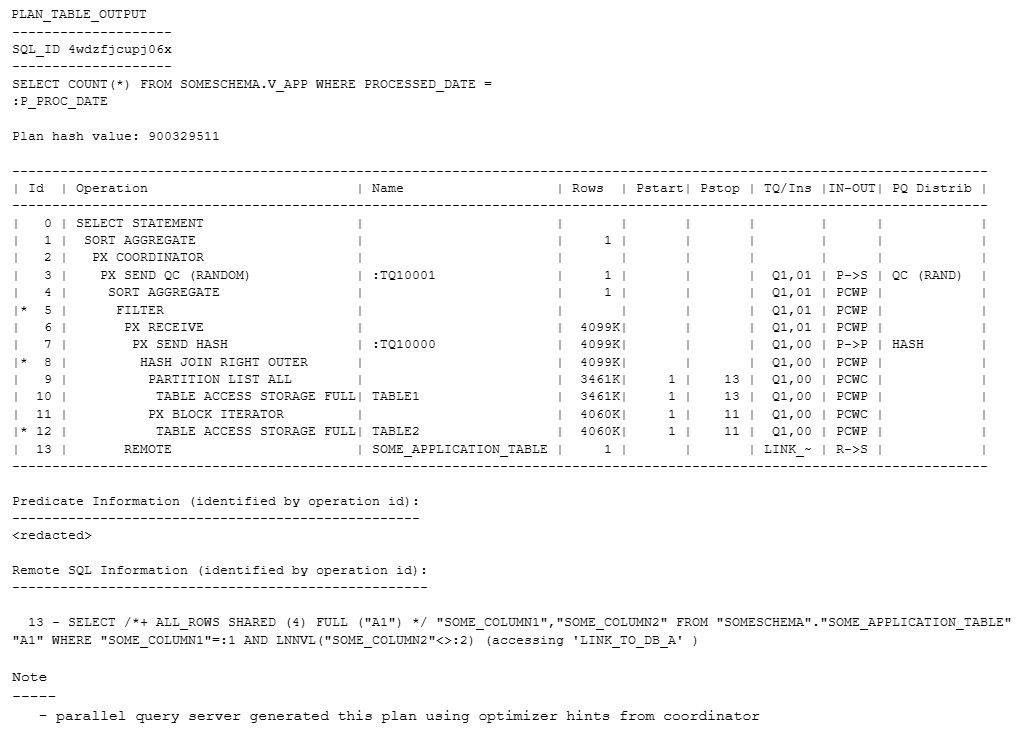
The SQL executed by the REMOTE operation in plan line 13 (reported under the "Remote SQL Information" section) revealed that this was indeed the initiator of SQL_ID 90mqxrgmxb6p9 in Database "A". The number of times this query executed over the database link was driven by plan line 6, which is confirmed by this SQL Monitoring report for a single query execution:
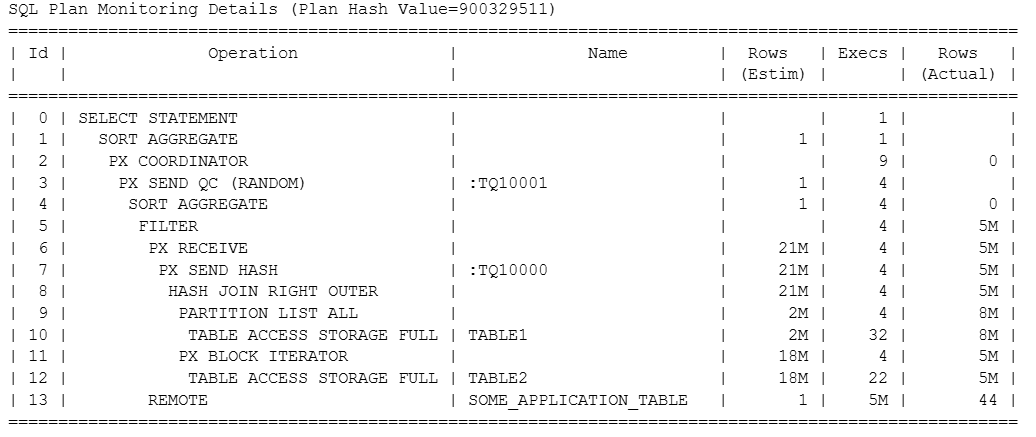
Plan line 6 returns 5M rows. That's exactly the number of times its child operation in plan line 13, the query executed over the DBlink, is executed. This explains why we saw so many executions of SQL_ID=90mqxrgmxb6p9 in database A.
As for why it was using a SHARED hint (alias for PARALLEL), the "Note" section reports: "parallel query server generated this plan using optimizer hints from coordinator". Because the execution plan in Database "B" was running in parallel, the REMOTE SQL was also executed in parallel. I set up a small test case to confirm this behavior: even if a table accessed over a database link contains just 1,000 rows and occupies only 8 data blocks, the query accessing it will still execute in parallel if the originating query is running in parallel.
With the root cause finally identified, I took measures to limit the problematic SQL's execution and work on its execution plan.
Oracle Database Consulting Services
Whether you're facing persistent ORA-04031 errors, tuning legacy execution plans, or optimizing high-concurrency RAC environments, Pythian’s certified Oracle DBAs and performance engineers are available 24/7 to help.
Let's eliminate your database bottlenecks and optimize your environment for stability.
Share this
Share this

HVR | Real-Time CDC ::Oracle Autonomous DW::
Running new Oracle DBSAT version 2.1.0 against Autonomous Database


.svg)
.svg)