Introduction
Every DBA should know that the baseline is one of the most important pieces to make a proactive troubleshoot to discover potential problems in your SQL Server environment. The baseline is a key point to measure the instance performance by capturing the data in regular intervals over time to establish a trendline and a pattern of your SQL Server instances. Without a proper baseline, it’s hard to say when and why the problem occurred. You also lose the ability to look over a period and analyze if a problem is really a problem, or if it is a normal environment behavior.Baseline Value
Here is one of the best examples to describe this – A customer opens a ticket informing that the SQL Server is running slow, and he needs to find the root cause of the problem because it’s impacting his business continuity. Before we dig into the investigation, there are some questions that should come to your mind, such as:- Have these issues been reported before?
- Do I have any useful information to guide me into this?
- Do I have a baseline established to verify the performance over a period and find why this came out now?
- Ad-Hoc query that is using all the available resources of the SQL Server machine.
- The developer team that changed a procedure code and now the query plan is causing more CXPACKET usage.
- The SQL Server that is sitting on a virtual machine that is using dynamic memory allocation and because of this is draining the memory.
- The primary site went down, and the DR site doesn’t have the same machine resources than the primary node has.
- The Database Administrator changed the compatibility mode of SQL Server from 2012 to 2014 and the new cost estimator for a particular plan is not behaving accordingly.
- One of the systems started to receive more incoming requests than normal. (i.e. Christmas and Black Friday)
- PAL – Performance Analysis of Log - https://straightpathsql.com/archives/2016/07/create-sql-server-baseline/
- Custom Scripts – DMV’s, DMF’s and Procedures - https://www.sqlskills.com/blogs/erin/sql-server-baselines-series-on-sqlservercentral-com/
TypePerf Command
That’s when the TypePerf command come into play, to help us Database Administrators to store and maintain performance counter information directly to SQL Server. Now there is no more need to save this information on a .xlx file and mark to import using BCP or SSIS or even using RELOG to put together the .blg and then import to SQL Server. Since Windows Server 2008 we have had this command available for use, and to be quite honest I was using an old school solution - too bad for me. A comment about scalability - I tested this solution in some clients, and at this moment I did not see any considerable bottleneck or latency on the capture process. Of course, this depends on your environment and the interval of your collection.Building Solution
First and foremost let’s create the database that will be used to store the performance counter data.- Creating Database Named – PerfMonBaseline
- Creating Views – vw_PerfMonAnalysisByServerperDay and vw_PerfMonAnalysisByserverperMinute
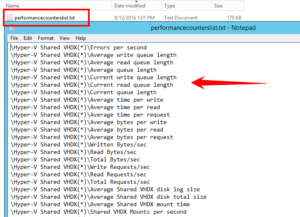
[code language="sql"]</pre> USE PerfMonBaseline go --DELETE FROM [dbo].[CounterDetails] --DELETE FROM [dbo].[CounterData] --DELETE FROM [dbo].[DisplayToID] SELECT DISTINCT [MachineName] FROM dbo.CounterDetails&nbsp;&nbsp;&nbsp; SELECT [DisplayString] , [LogStartTime] , [LogStopTime] FROM dbo.DisplayToID SELECT MachineName , CounterName , InstanceName , MIN(CounterValue) AS minValue , MAX(CounterValue) AS maxValue , AVG(CounterValue) AS avgValue , DisplayString FROM dbo.CounterDetails cdt INNER JOIN dbo.CounterData cd ON cdt.CounterID = cd.CounterID INNER JOIN dbo.DisplayToID d ON d.GUID = cd.GUID GROUP BY MachineName, CounterName, InstanceName, DisplayString USE PerfMonBaseline go DROP VIEW vw_PerfMonAnalysisByServerperDay go CREATE VIEW vw_PerfMonAnalysisByServerperDay AS SELECT REPLACE(MachineName,'\','') AS ServerName , CounterName , MIN(CounterValue) AS minValue , MAX(CounterValue) AS maxValue , AVG(CounterValue) AS avgValue , DAY(CAST(LEFT(CounterDateTime,10) AS DATETIME)) AS [Day] , MONTH(CAST(LEFT(CounterDateTime,10) AS DATETIME)) AS [Month] , YEAR(CAST(LEFT(CounterDateTime,10) AS DATETIME)) AS [Year] FROM dbo.CounterDetails cdt INNER JOIN dbo.CounterData cd ON cdt.CounterID = cd.CounterID INNER JOIN dbo.DisplayToID d ON d.GUID = cd.GUID GROUP BY MachineName, CounterName, DAY(CAST(LEFT(CounterDateTime,10) AS DATETIME)), MONTH(CAST(LEFT(CounterDateTime,10) AS DATETIME)), YEAR(CAST(LEFT(CounterDateTime,10) AS DATETIME)) go DROP VIEW vw_PerfMonAnalysisByServerperMinute go CREATE VIEW vw_PerfMonAnalysisByServerperMinute AS SELECT REPLACE(MachineName,'\','') AS ServerName , CounterName , MIN(CounterValue) AS minValue , MAX(CounterValue) AS maxValue , AVG(CounterValue) AS avgValue , DAY(CAST(LEFT(CounterDateTime,10) AS DATETIME)) AS [Day] , MONTH(CAST(LEFT(CounterDateTime,10) AS DATETIME)) AS [Month] , YEAR(CAST(LEFT(CounterDateTime,10) AS DATETIME)) AS [Year] FROM dbo.CounterDetails cdt INNER JOIN dbo.CounterData cd ON cdt.CounterID = cd.CounterID INNER JOIN dbo.DisplayToID d ON d.GUID = cd.GUID GROUP BY MachineName, CounterName, DAY(CAST(LEFT(CounterDateTime,10) AS DATETIME)), MONTH(CAST(LEFT(CounterDateTime,10) AS DATETIME)), YEAR(CAST(LEFT(CounterDateTime,10) AS DATETIME)) <pre>[/code] Now it’s time to show how TypePerf works. Tn the next step, we will create an ODBC connection that will be used from TypePerf to save the performance data directly into SQL Server. Creating ODBC on Local Server Open ODBC Data Sources (64-Bit) Tab User DSN and Add Data Source Use SQL Server Data Source Name = PerfMonBaseline Server = [ServerName] Add Proper Credential Mark – “Perform Translation for Character Data” Test Data Source A quick recap - we’ve created the database, views and the connection [ODBC] that will permit TypePerf to store the performance counter information and store in a sync fashion. We’re almost there. Now to make our process mature and solid, let’s create a .txt file named – perfcounterssql and add all the collectors that we’re interested in capturing and storing inside of our database. If your idea is to collect a considerable amount of counters I would suggest running this command. It will populate a file with all available counters for this particular instance. You can remove those that you don’t want to collect. [code language="sql"]</pre> TYPEPERF -q >"C:\BaseDados\temp\performancecounterslist.txt" <pre>[/code]
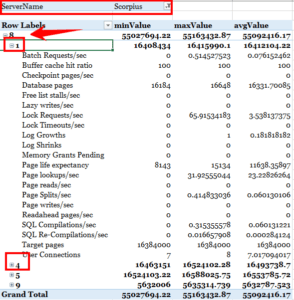
One of the questions that pop into my mind now is "why do I love this solution?" Simply for the fact that I can collect not only the server that I’m running but that I can extend the collection and start to capture information for all my SQL Server machines by just adding the name of the server and the collector that I want to capture, for example: \\Scorpius\\SQLServer:General Statistics\User Connections \\Scorpius\\SQLServer:Memory Manager\Memory Grants Pending \\Scorpius\\System\Processor Queue Length \\Serpens\\SQLServer:Buffer Manager\Buffer cache hit ratio \\Serpens\\SQLServer:Buffer Manager\Page lookups/sec Note that I’m capturing information from the instances called Scorpius and Serpens. Here is the collector that I’m using in my current solution, file named – perfcounterssqlserver.txt \\Scorpius\\SQLServer:Buffer Manager\Buffer cache hit ratio \\Scorpius\\SQLServer:Buffer Manager\Page lookups/sec \\Scorpius\\SQLServer:Buffer Manager\Free list stalls/sec \\Scorpius\\SQLServer:Buffer Manager\Free pages \\Scorpius\\SQLServer:Buffer Manager\Total pages \\Scorpius\\SQLServer:Buffer Manager\Target pages \\Scorpius\\SQLServer:Buffer Manager\Database pages \\Scorpius\\SQLServer:Buffer Manager\Reserved pages \\Scorpius\\SQLServer:Buffer Manager\Stolen pages \\Scorpius\\SQLServer:Buffer Manager\Lazy writes/sec \\Scorpius\\SQLServer:Buffer Manager\Readahead pages/sec \\Scorpius\\SQLServer:Buffer Manager\Page reads/sec \\Scorpius\\SQLServer:Buffer Manager\Page writes/sec \\Scorpius\\SQLServer:Buffer Manager\Checkpoint pages/sec \\Scorpius\\SQLServer:Buffer Manager\AWE lookup maps/sec \\Scorpius\\SQLServer:Buffer Manager\AWE stolen maps/sec \\Scorpius\\SQLServer:Buffer Manager\AWE write maps/sec \\Scorpius\\SQLServer:Buffer Manager\AWE unmap calls/sec \\Scorpius\\SQLServer:Buffer Manager\AWE unmap pages/sec \\Scorpius\\SQLServer:Buffer Manager\Page life expectancy \\Scorpius\\Memory\Available MBytes \\Scorpius\\Paging File(_Total)\% Usage \\Scorpius\\PhysicalDisk(* *)\% Disk Time \\Scorpius\\PhysicalDisk(* *)\Avg. Disk Queue Length \\Scorpius\\PhysicalDisk(* *)\Avg. Disk sec/Read \\Scorpius\\PhysicalDisk(* *)\Avg. Disk sec/Write \\Scorpius\\PhysicalDisk(* *)\Disk Reads/sec \\Scorpius\\PhysicalDisk(* *)\Disk Writes/sec \\Scorpius\\Processor(*)\% Processor Time \\Scorpius\\SQLServer:General Statistics\User Connections \\Scorpius\\SQLServer:Memory Manager\Memory Grants Pending \\Scorpius\\System\Processor Queue Length \\Serpens\\SQLServer:Buffer Manager\Buffer cache hit ratio \\Serpens\\SQLServer:Buffer Manager\Page lookups/sec \\Serpens\\SQLServer:Buffer Manager\Free list stalls/sec \\Serpens\\SQLServer:Buffer Manager\Free pages \\Serpens\\SQLServer:Buffer Manager\Total pages \\Serpens\\SQLServer:Buffer Manager\Target pages \\Serpens\\SQLServer:Buffer Manager\Database pages \\Serpens\\SQLServer:Buffer Manager\Reserved pages \\Serpens\\SQLServer:Buffer Manager\Stolen pages \\Serpens\\SQLServer:Buffer Manager\Lazy writes/sec \\Serpens\\SQLServer:Buffer Manager\Readahead pages/sec \\Serpens\\SQLServer:Buffer Manager\Page reads/sec \\Serpens\\SQLServer:Buffer Manager\Page writes/sec \\Serpens\\SQLServer:Buffer Manager\Checkpoint pages/sec \\Serpens\\SQLServer:Buffer Manager\AWE lookup maps/sec \\Serpens\\SQLServer:Buffer Manager\AWE stolen maps/sec \\Serpens\\SQLServer:Buffer Manager\AWE write maps/sec \\Serpens\\SQLServer:Buffer Manager\AWE unmap calls/sec \\Serpens\\SQLServer:Buffer Manager\AWE unmap pages/sec \\Serpens\\SQLServer:Buffer Manager\Page life expectancy \\Serpens\\Memory\Available MBytes \\Serpens\\Paging File(_Total)\% Usage \\Serpens\\PhysicalDisk(* *)\% Disk Time \\Serpens\\PhysicalDisk(* *)\Avg. Disk Queue Length \\Serpens\\PhysicalDisk(* *)\Avg. Disk sec/Read \\Serpens\\PhysicalDisk(* *)\Avg. Disk sec/Write \\Serpens\\PhysicalDisk(* *)\Disk Reads/sec \\Serpens\\PhysicalDisk(* *)\Disk Writes/sec \\Serpens\\Processor(*)\% Processor Time \\Serpens\\SQLServer:General Statistics\User Connections \\Serpens\\SQLServer:Memory Manager\Memory Grants Pending \\Serpens\\System\Processor Queue Length \\Serpens\\SQLServer:SQL Statistics\Batch Requests/sec \\Scorpius\\SQLServer:SQL Statistics\Batch Requests/sec \\Serpens\\SQLServer:SQL Statistics\SQL Compilations/sec \\Scorpius\\SQLServer:SQL Statistics\SQL Compilations/sec \\Serpens\\SQLServer:SQL Statistics\SQL Re-Compilations/sec \\Scorpius\\SQLServer:SQL Statistics\SQL Re-Compilations/sec \\Scorpius\\SQLServer:Buffer Manager\Page reads/sec \\Scorpius\\SQLServer:Buffer Manager\Page writes/sec \\Scorpius\\SQLServer:Buffer Manager\Checkpoint pages/sec \\Scorpius\\SQLServer:Buffer Manager\Lazy writes/sec \\Scorpius\\SQLServer:Locks(*)\Lock Requests/sec \\Scorpius\\SQLServer:Locks(*)\Lock Timeouts/sec \\Scorpius\\SQLServer:Databases(*)\Log Growths \\Scorpius\\SQLServer:Databases(*)\Log Shrinks \\Scorpius\\SQLServer:Access Methods\Page Splits/sec \\Serpens\\SQLServer:Buffer Manager\Page reads/sec \\Serpens\\SQLServer:Buffer Manager\Page writes/sec \\Serpens\\SQLServer:Buffer Manager\Checkpoint pages/sec \\Serpens\\SQLServer:Buffer Manager\Lazy writes/sec \\Serpens\\SQLServer:Locks(*)\Lock Requests/sec \\Serpens\\SQLServer:Locks(*)\Lock Timeouts/sec \\Serpens\\SQLServer:Databases(*)\Log Growths \\Serpens\\SQLServer:Databases(*)\Log Shrinks \\Serpens\\SQLServer:Access Methods\Page Splits/sec Now that we have the database, connectivity, and collectors stored in a file, it’s time to test and see if the process is storing the information directly into SQL Server. Before we start the process there are a few options that we need to know to run the command. The si and sc parameters are crucial for us and in this case we need to finely adjust to avoid any contention on the server.
- SI = Sample Interval
- SC = Samples
Testing and Scheduling Daily Run
Open PowerShell ISE and use this command bellow making the adjustments for your environment. [code language="sql"]</pre> TYPEPERF -f SQL -s Serpens -cf "C:\BaseDados\temp\perfcounterssqlserver.txt" -si 60 -sc 720 SQL:PerfMonBaseline!log1 <pre>[/code] -f = SQL Server Type -s = ServerName -cf = Performance Counter File -si = Sample Interval = 60 -sc = Sample Amount = 720 SQL:PerfMonBaseline = Name of ODBC Data Source I would recommend creating two SQL Server Agent Jobs PerfMonRecordSampleData Schedule Time = 08:00 AM Daily [code language="sql"]</pre> TYPEPERF -f SQL -s Serpens -cf "C:\BaseDados\temp\perfcounterssqlserver.txt" -si 60 -sc 720 SQL:PerfMonBaseline!log1 <pre>[/code] Purge – PerfMonBaselineData Schedule Time = 10:00 PM on Sunday [code language="sql"]</pre> DELETE FROM PerfMonBaseline.dbo.CounterData WHERE CONVERT(DATETIME,SUBSTRING(CounterDateTime,0,20)) < DATEADD(HH, -168, GETDATE()) <h3>[/code]Exposing Data
Now that you’ve your own baseline repository containing performance information, you can create an Excel workbook, or create beautiful reports using PowerView, or move this to PowerBI and elevate your analysis to the next level.
Conclusion
The sky is the limit! You can use the Erin Stellato solution together and increase your baseline repository. Here is some useful information for further exploration: https://technet.microsoft.com/en-us/library/cc753182(v=ws.11).aspx https://sqlmag.com/sql-server/q-restore-missing-sql-server-performance-counters https://technet.microsoft.com/en-us/library/bb490960.aspx https://blogs.technet.microsoft.com/askperf/2009/05/12/two-minute-drill-typeperf/
SQL Server Database Consulting Services
Ready to future-proof your SQL Server investment?
Share this
Share this
SMB File Share and SQL Server: An option to consider
Fix: SQL Server to PostgreSQL Linked Server Error - "Requested conversion is not supported."