


What Enterprise IT Leaders Are Really Saying About AI
Enterprise AI has reached an interesting inflection point.
Enterprise AI has reached an interesting inflection point.
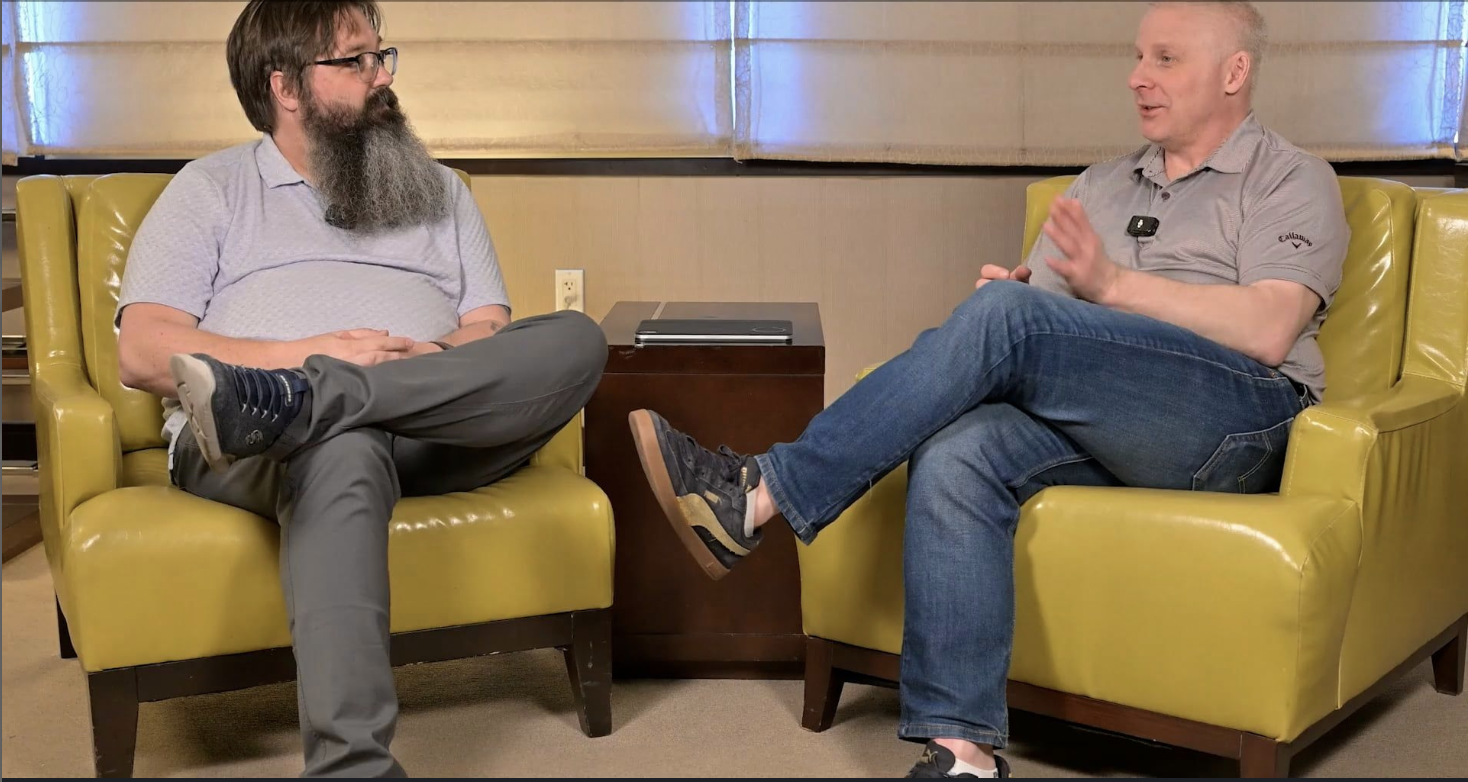
In a recent interview on the Business Disruptions in Tech podcast, Howard Holton and Pythian CTO Paul Lewis discussed ...
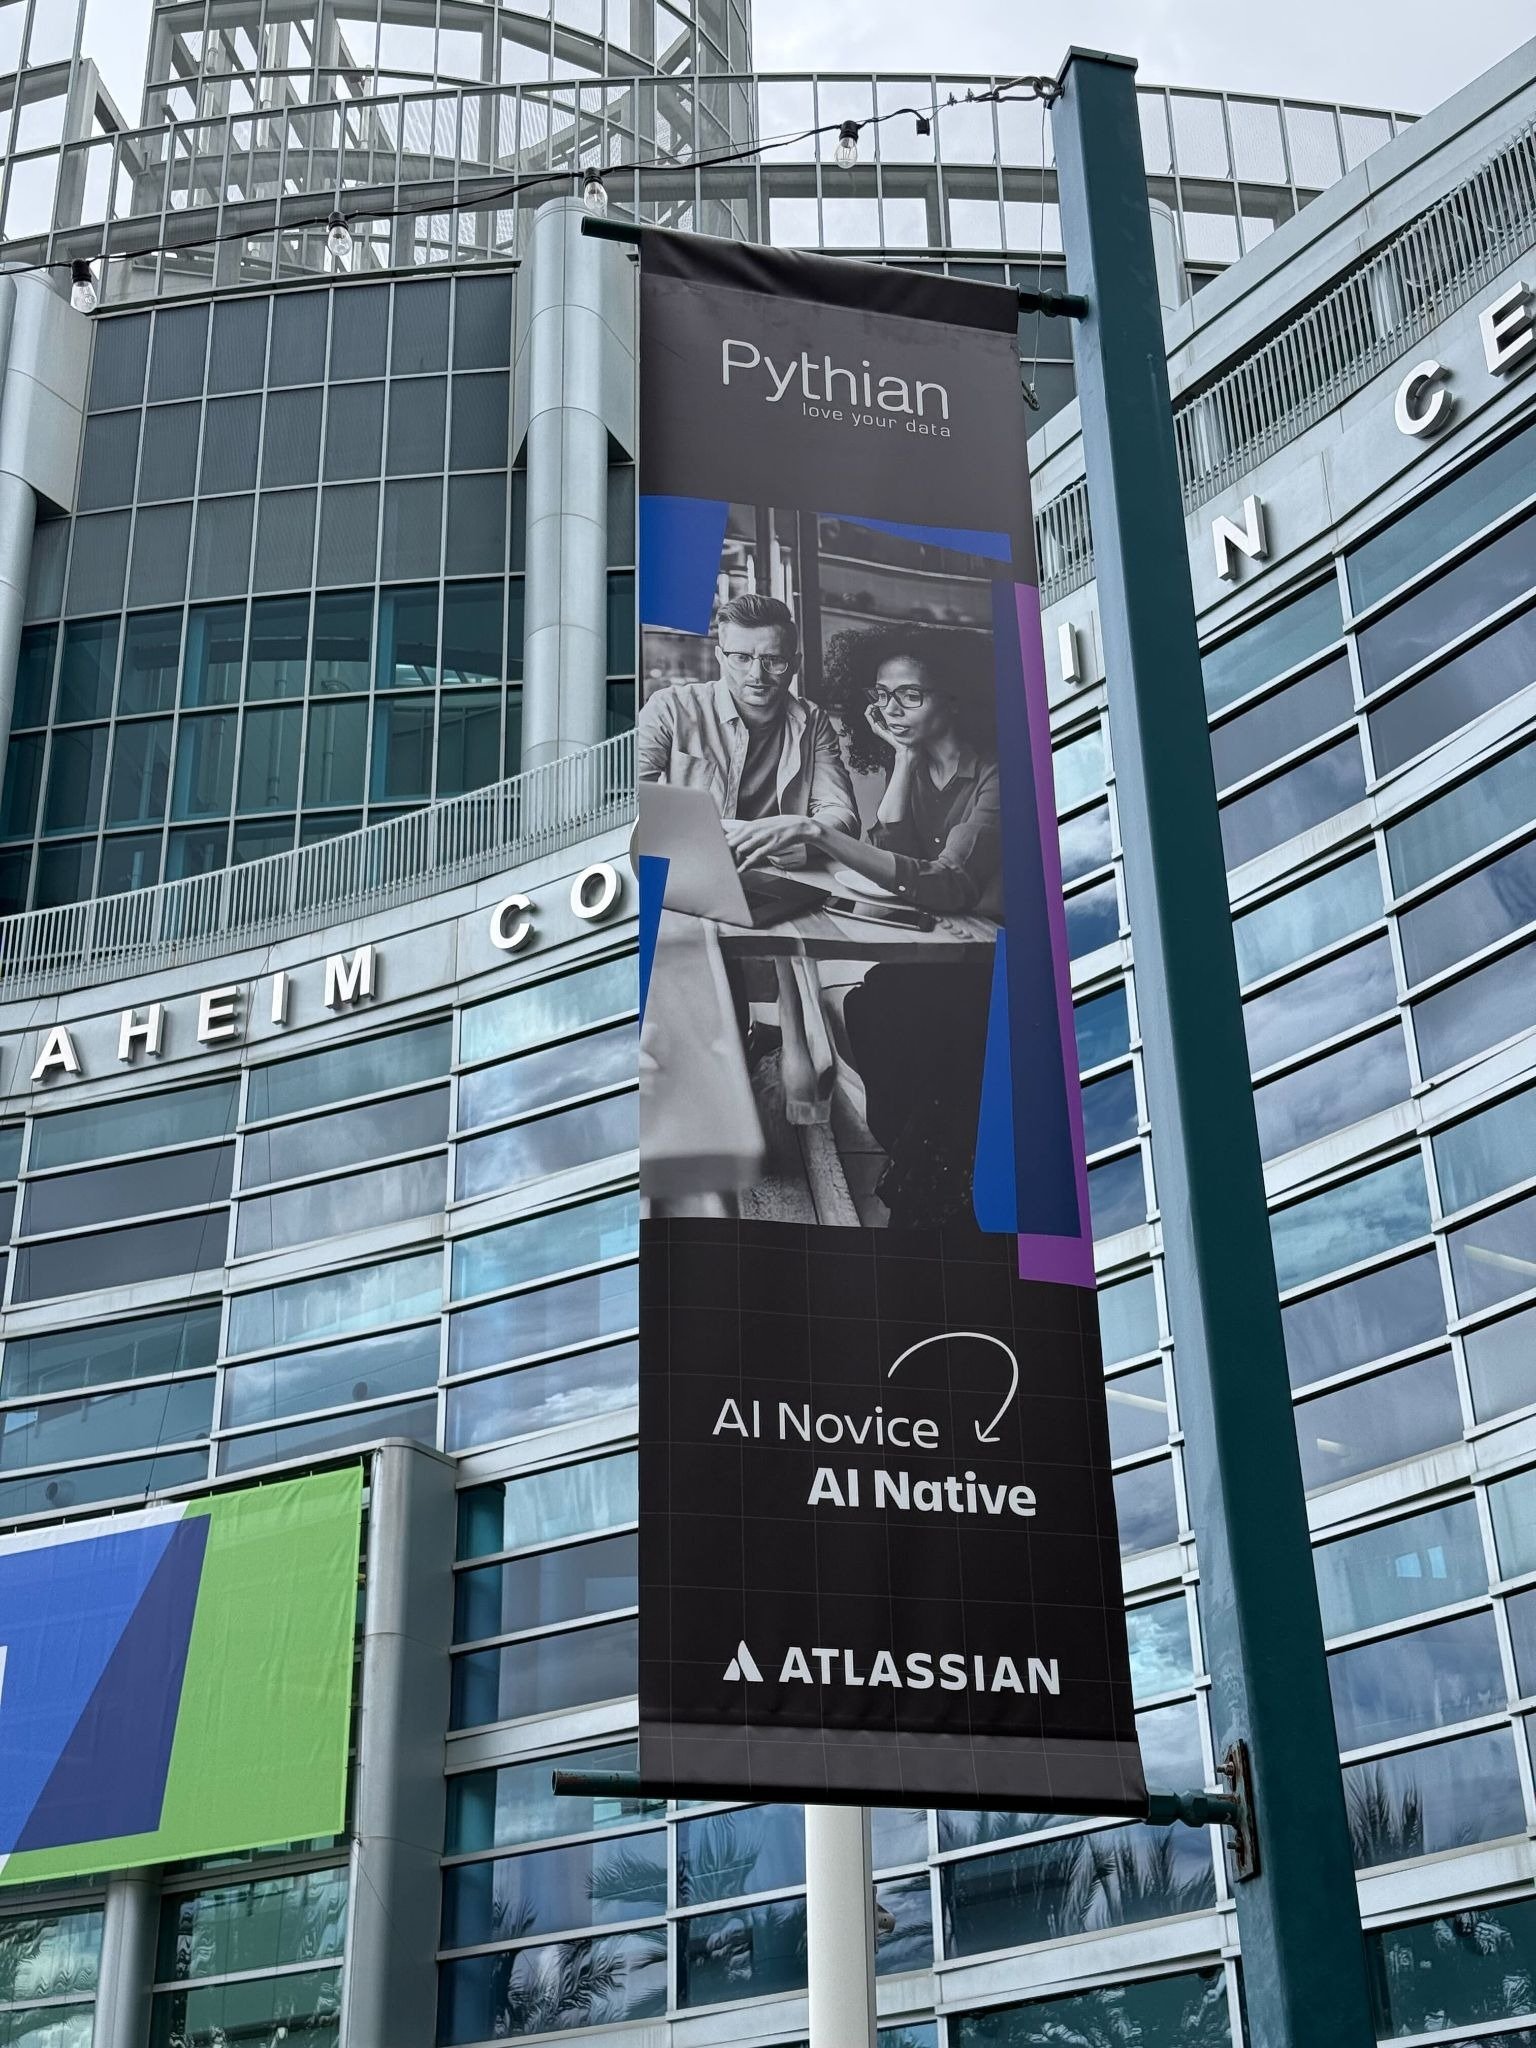
We are proud to announce that Pythian has been officially recognized at Atlassian Team ’26 as a winner of the ...

Why “AI Gravity” determines where Google and NVIDIA win In 2026, the AI conversation has shifted. We’ve moved past ...

In 2026, the cloud conversation has shifted from infrastructure to outcomes. The question is no longer “Should we move ...

Agentic AI design patterns are the architectural blueprints that describe artificial intelligence systems to plan, ...
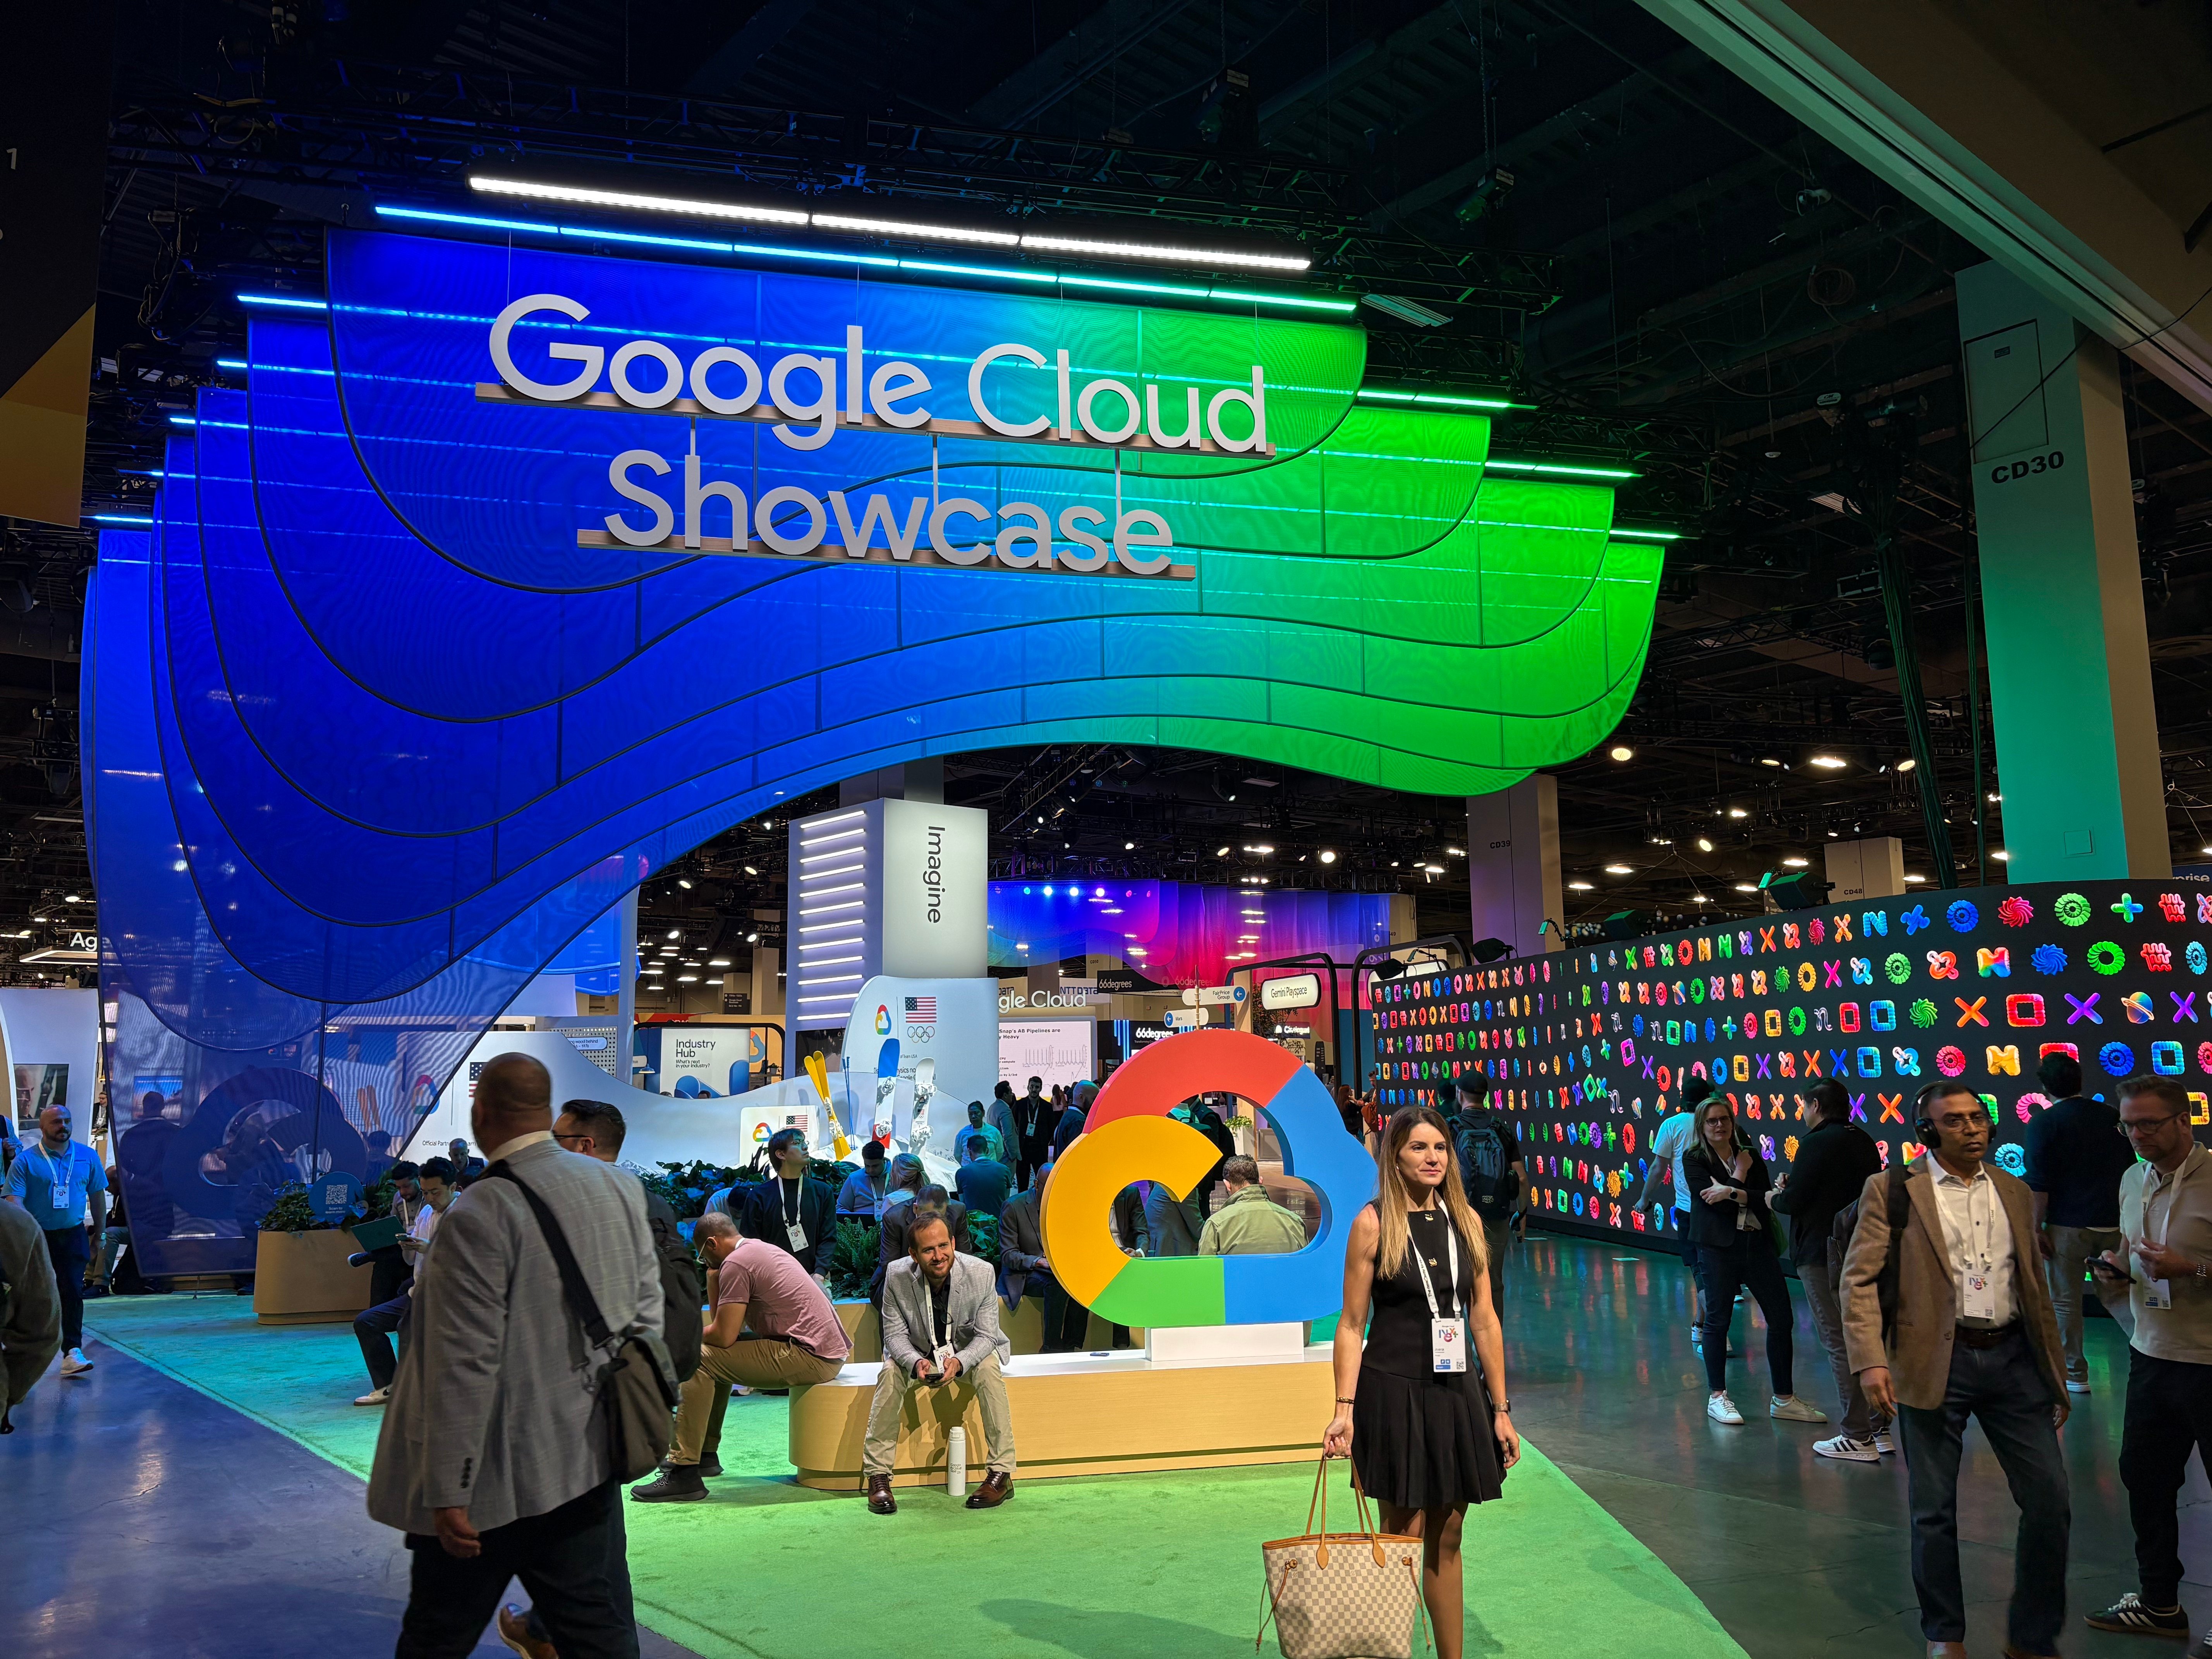
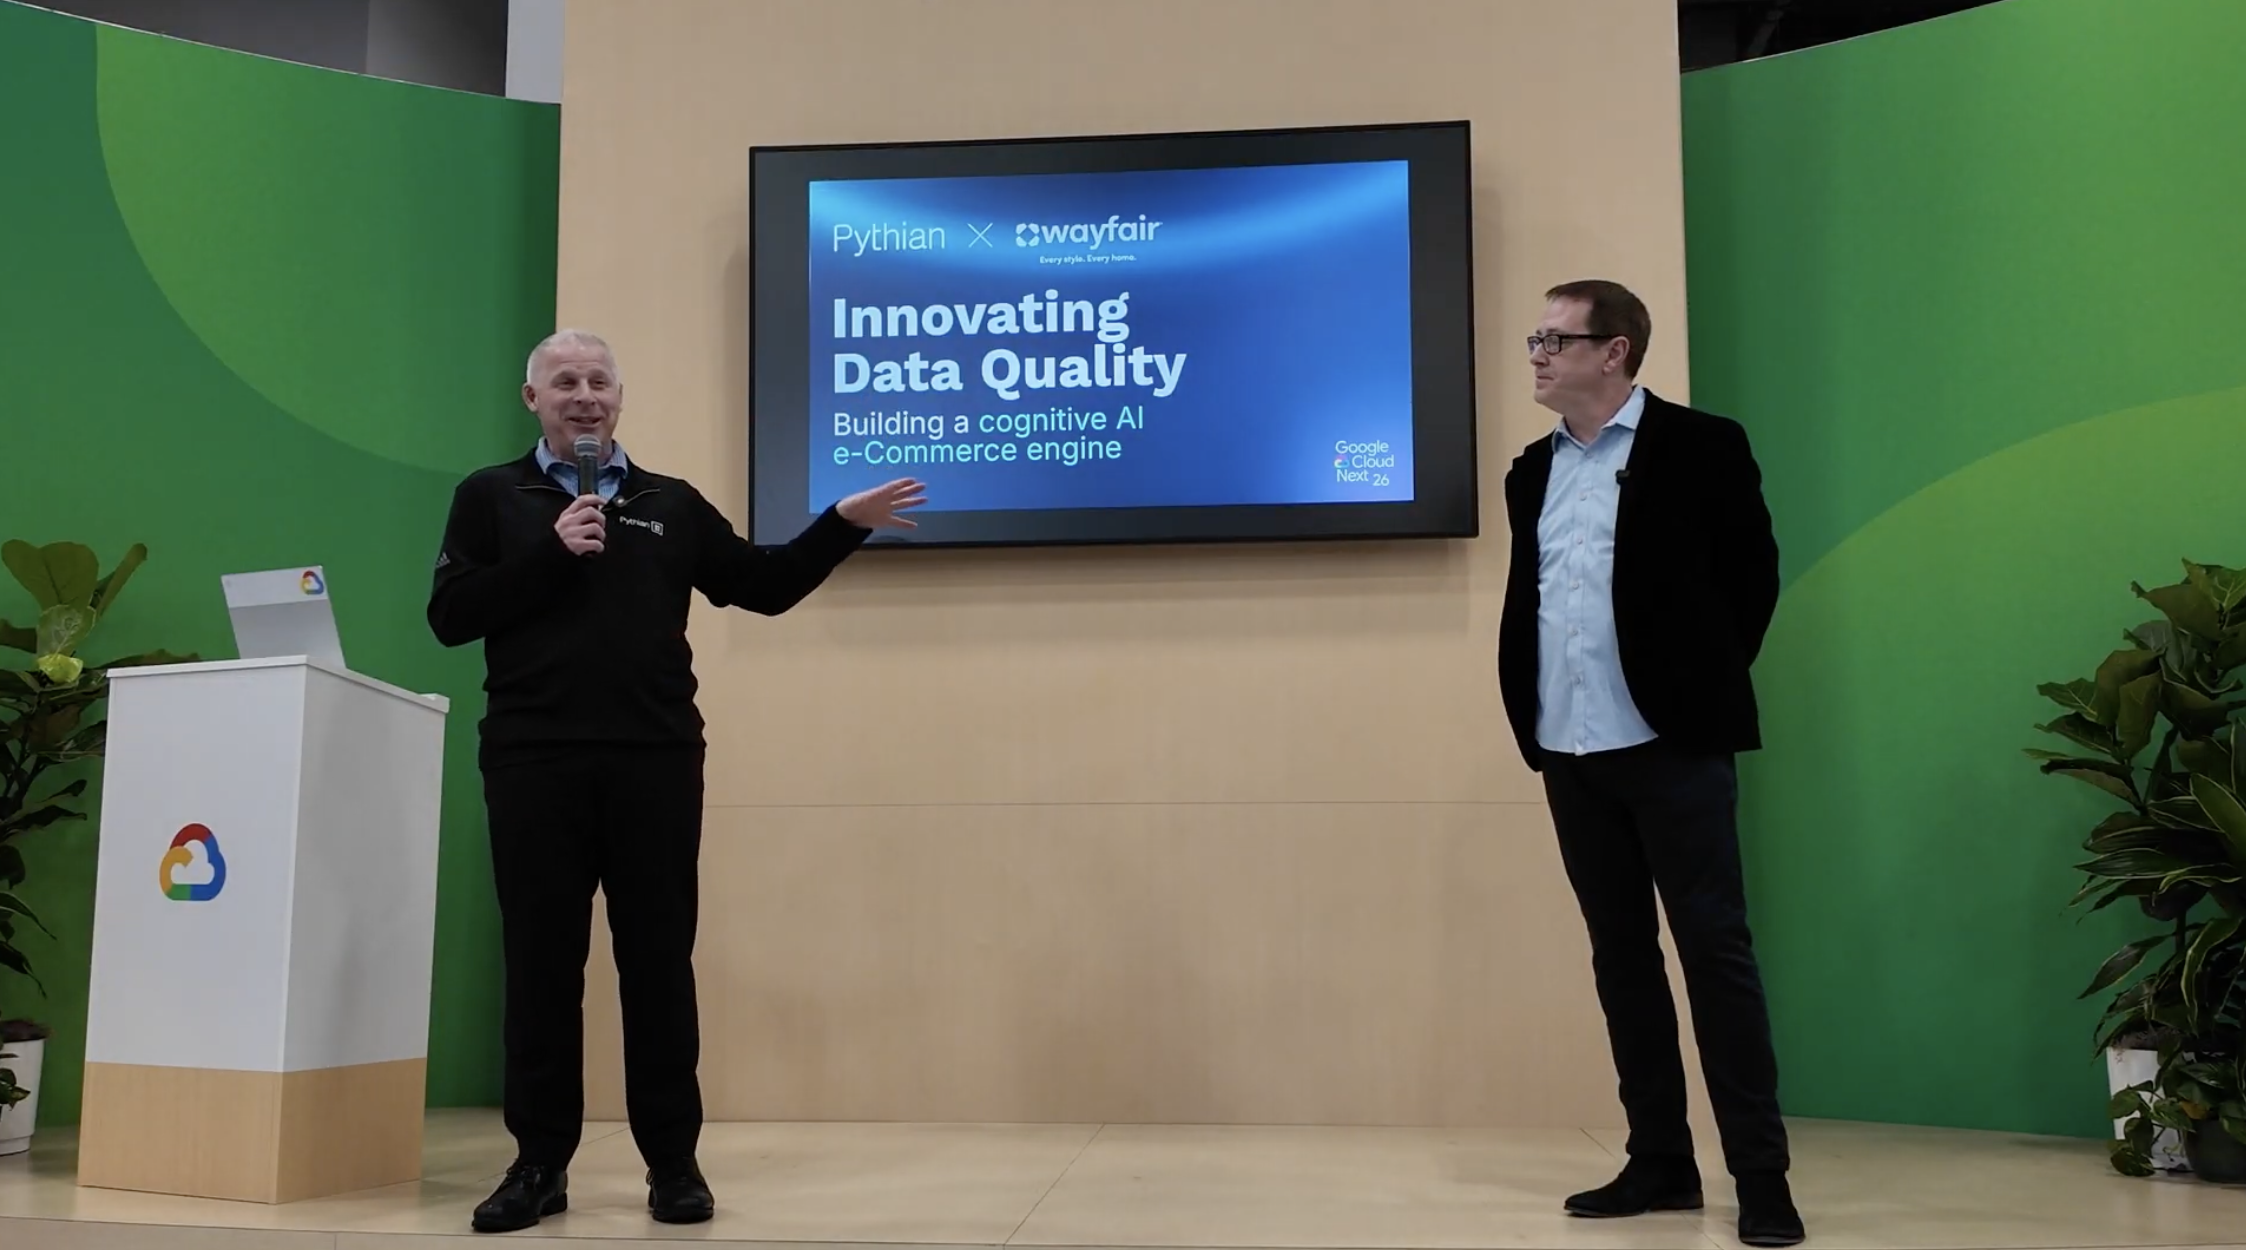
I just returned from Google Next 2026, and if there’s one takeaway that stood out, it’s this: we are officially moving ...

It’s 2026, and in my role as a Customer Engineer within the Google Cloud ecosystem, I’m spending a lot of my time ...

Technology is the easy part. The people? That’s where the real challenge—and the real magic—happens.
In the world of high-tech manufacturing, complexity isn't just a challenge—it’s the baseline. For Sanmina, a Fortune ...
The retail landscape is no longer just about having the best product on the shelf; it’s about having governed data that ...
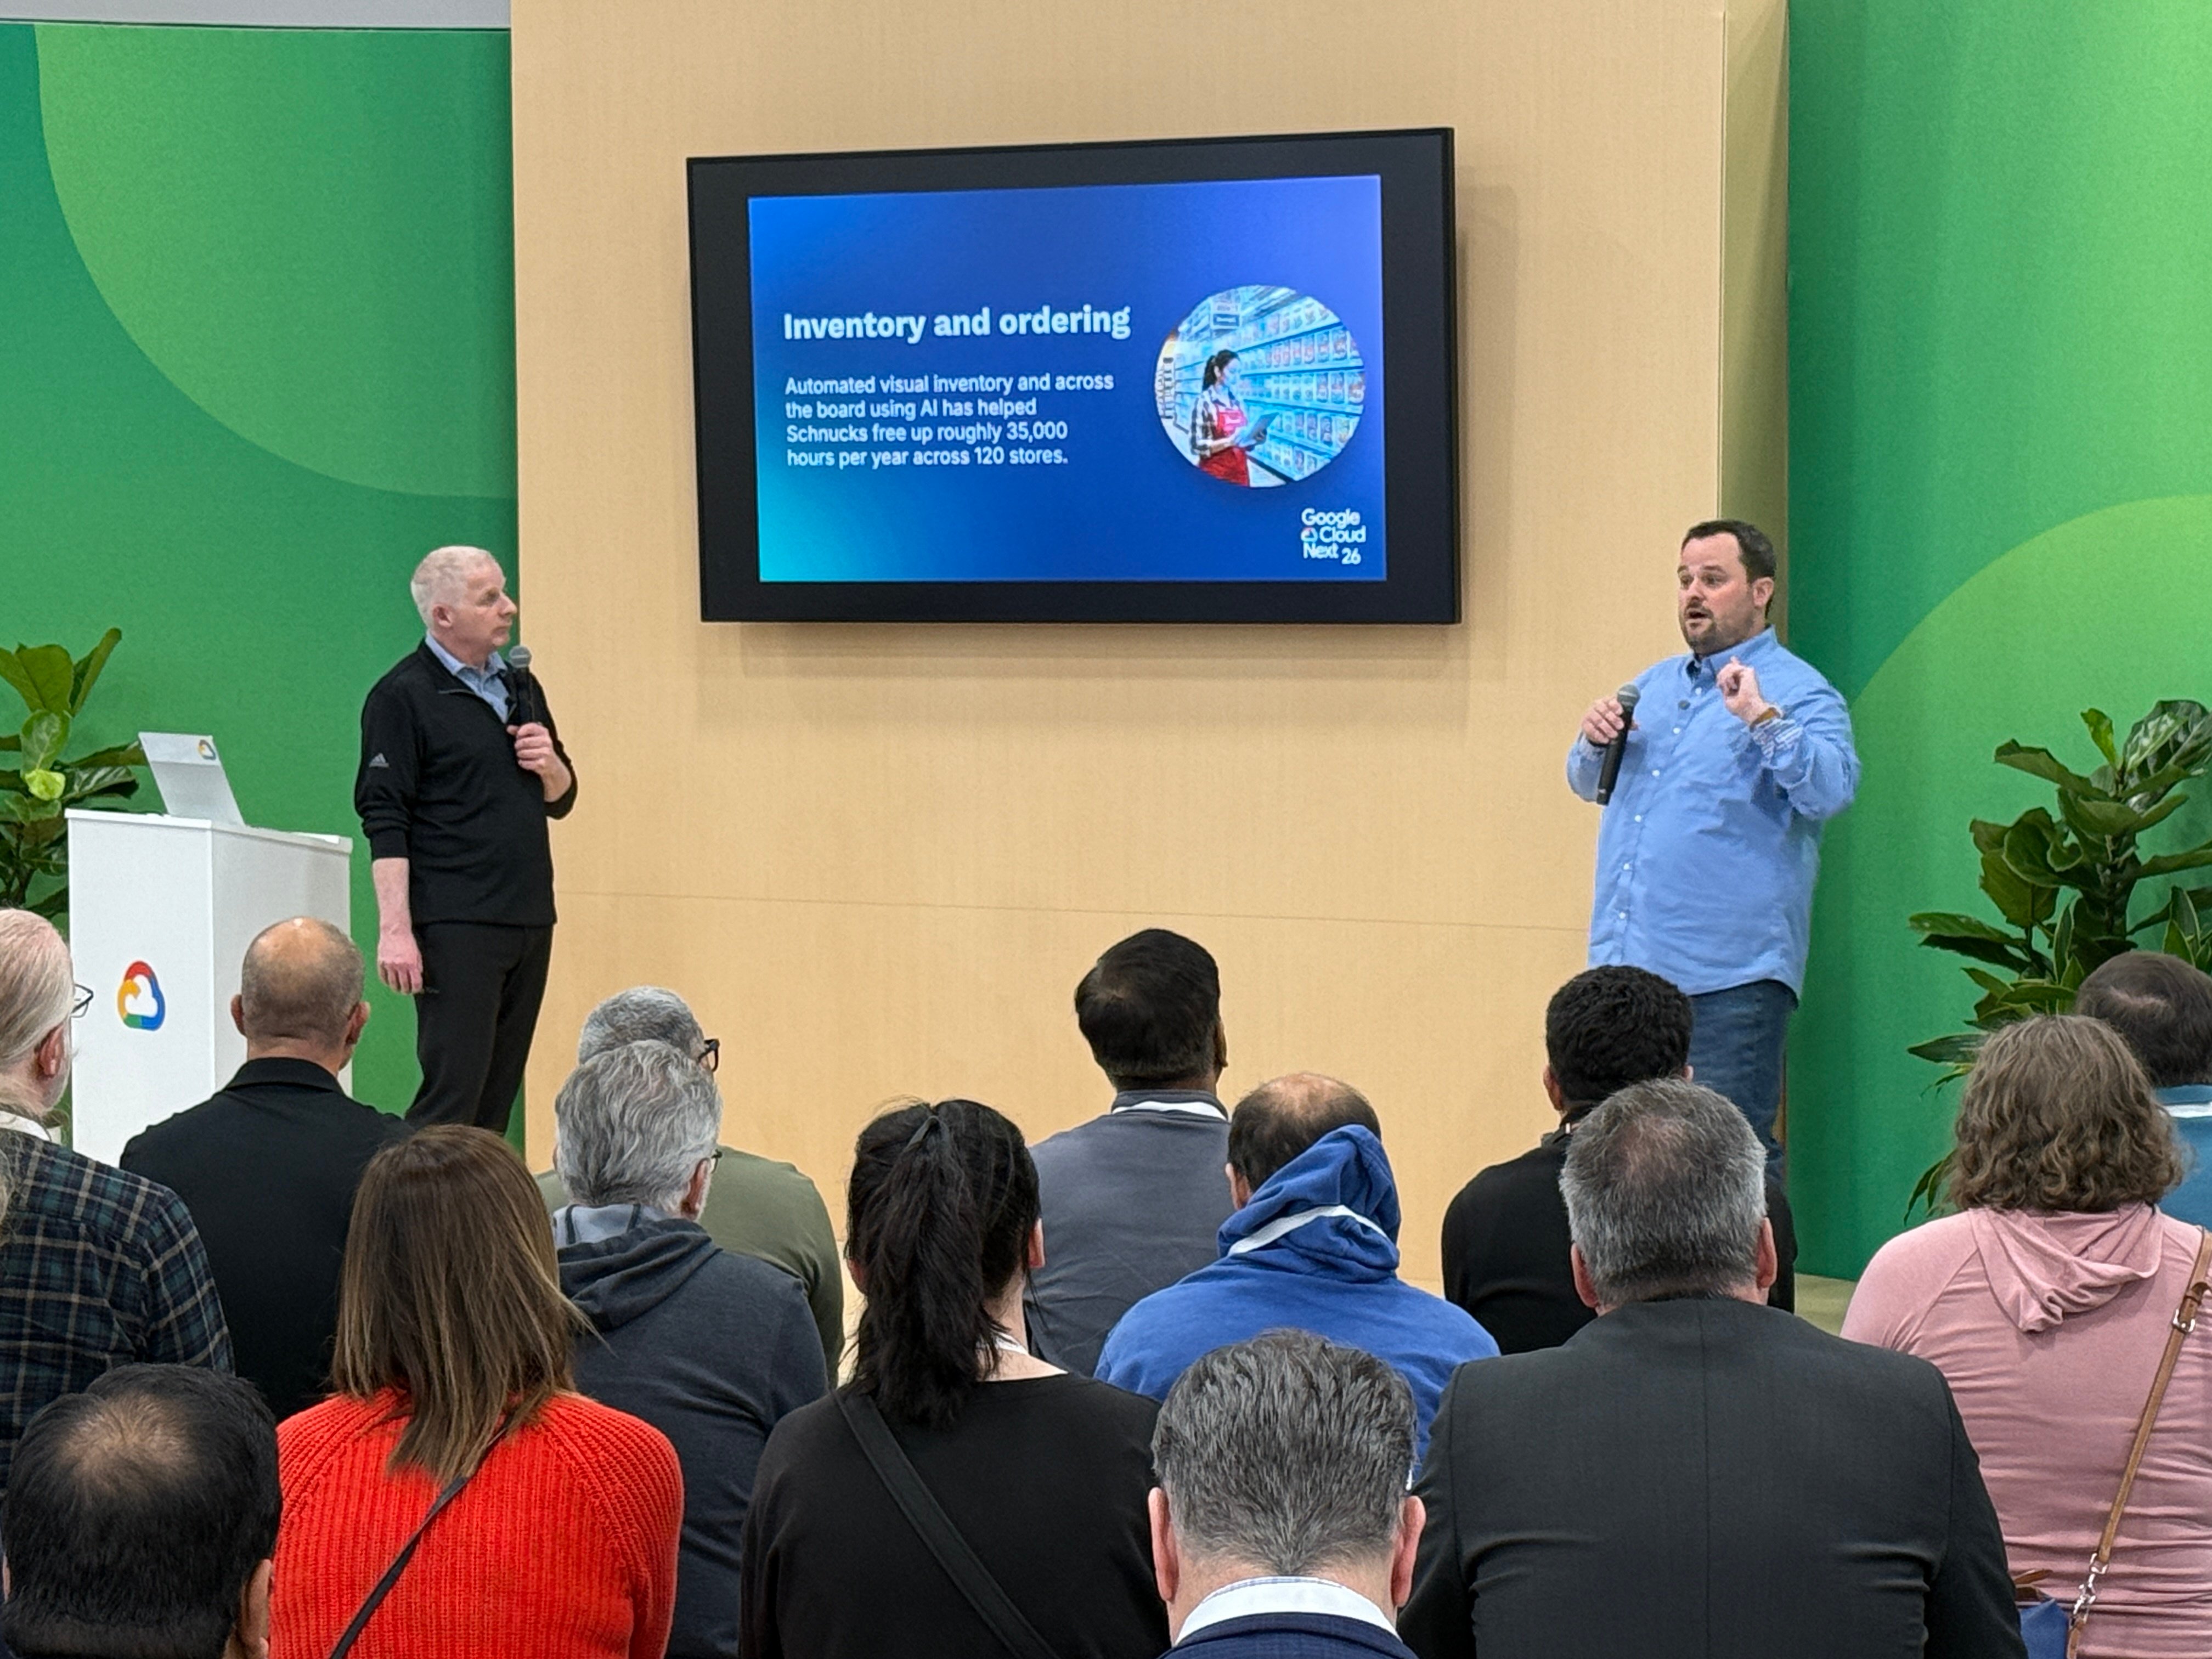
The grocery industry has long been defined by razor-thin margins and intense manual labor. From the back-office hum of ...
The dust has finally settled on Google Cloud Next 26, and if there is one definitive takeaway, it is this: the era of ...
Google’s New Vision: What the Agent Platform Actually Is Gemini Enterprise Agent Platform is Google’s evolution of ...
The dust has barely settled on Google Cloud Next '26 keynote address, and the message from the keynote stage was clear: ...

What is Production AI? Moving Beyond the Pilot “Production AI is the deployment of AI solutions into core business ...

Good DAX performance usually comes down to avoiding just a few common mistakes.

As DevOps engineers, we often talk about “infrastructure as code,” but too rarely do we talk about code as a craft. ...

After applying a Critical Patch Update (CPU) or a specific bundle patch to an Oracle Forms 12c environment, you might ...

Pythian migrated a decade-old Teradata warehouse to BigQuery without disrupting 24/7 operations This organization built ...
How Pythian helped a global IT services provider exit Vertica Enterprise Mode and deliver production analytics and AI A ...

Oracle’s AI Data Platform (AIDP) is essentially an attempt to fix the biggest annoyance in enterprise architectures: ...

The AI implementation consultant services market is booming, projected to grow from $11.07 billion in 2025 to $90.99 ...

Many enterprises have an AI strategy—but nearly none have an AI implementation strategy.

Corporate AI implementation failure has become one of the defining technology challenges of 2025 and 2026. Despite ...

Your primary data center hums along in Chicago. A disaster-recovery site sits in Phoenix. Edge nodes are scattered ...

When a critical server fails at 3 a.m., someone has to wake up and fix it. For most enterprise IT teams, that reality ...

For an effective, integrated cloud, you can't have a patchwork of disconnected vendors. Instead, you need end-to-end ...
Introduction For a long time now I've wanted to start a blog series outlining the not-so-obvious things that have ...


-1.jpg)
.jpg)


Follow Us ![]()
![]()
![]()